

The Tampa-St. Petersburg-Clearwater, FL Metropolitan Statistical Area (Tampa MSA) has been a high-performing market and a favorite amongst investors since the last recession. It’s been hot in terms of population, job growth, rental, and price appreciation over the last five years. However, rolling COVID-19 concerns, economic shocks, and unpredictable government stimulus have changed the dynamics of the real estate market.
POPULATION GROWTH
The 2019 Census/ACS data shows the Tampa metro is the 18th largest MSA in the U.S. with nearly 3.2 million residents. The metro area added 40,000 residents between 2018 and 2019 (a 1.2 percent increase) and had the 42nd largest five-year increase with nearly 270,000 new residents (a 9.1 percent gain). This strong increase in population has helped increase the demand for housing.
ECONOMY & JOB MARKET
The Tampa MSA economy is the 24th largest in the U.S. by GDP. The market GDP has surged nearly 3% per year between 2013 and 2018. Higher wage jobs in the financial, professional services, education and healthcare sectors have been steadily increasing over the past 20 years. Companies operating here enjoy low labor costs, favorable corporate tax policies, no personal income tax, and stable, pro-business leadership.
Tampa Bay is home to 20 corporate headquarters with over $1 billion in annual revenue, eight of which are Fortune 1000 companies. Nearly one in four business and information services firms based in Florida are located here.
According to the BLS MSA-level Employment Report, the Tampa MSA is still down -7.2 percent (101,200 jobs) between February and July 2020, the market has reclaimed about one-third of the total jobs lost from the lows in April. Some job industries have bounced back quickly, but data as of July represents a setback of nearly all jobs gained over the last three years.
Job Industries in the Tampa MSA through July 2020 are as follows.
| Industry Group | July 2020 Employment | Share of Jobs | Chg vs Feb 2020 High |
Percent Chg vs Feb 2020 High |
5 yr chg |
5 yr % chg |
| Trade, Transportation, and Utilities |
242,300 |
18.9% |
(12,000) |
-4.72% |
5,700 |
2.41% |
| Education and Health Services |
212,100 |
16.1% |
(15,800) |
-6.93% |
20,500 |
10.70% |
| Professional and Business Services |
236,300 |
15.9% |
(14,600) |
-5.82% |
17,700 |
8.10% |
| Government |
147,500 |
13.4% |
(15,200) |
-9.34% |
3,800 |
2.64% |
| Leisure and Hospitality |
133,400 |
11.0% |
(32,600) |
-19.64% |
(10,400) |
-7.23% |
| Financial Activities |
120,700 |
8.2% |
(3,000) |
-2.43% |
16,200 |
15.50% |
| Manufacturing |
68,300 |
5.4% |
(2,400) |
-3.39% |
5,600 |
8.93% |
| Construction |
83,700 |
4.8% |
1,400 |
1.70% |
18,800 |
28.97% |
| Other Services |
43,200 |
3.8% |
(5,400) |
-11.11% |
200 |
0.47% |
| Information |
23,800 |
2.4% |
(1,600) |
-6.30% |
(2,200) |
-8.46% |
| Mining and Logging |
300 |
0.2% |
– |
0.00% |
(100) |
-25.00% |
| TOTALS |
1,311,600 |
|
(101,200) |
75,800 |
|
UNEMPLOYMENT
The Tampa MSA hit a low unemployment rate of 2.9 percent in December 2019. Due to a major slowdown in tourism, the unemployment rate spiked to a record high 13.2 percent in April, surpassing the previous record of 11.7 percent in Jan 2010. Governor DeSantis initiated Phase 2 reopening June 5th, which helped to restore many temporary layoffs, and lowered the unemployment rate to nine percent in June.
However, a resurgence of COVID cases in late June and July has frozen the jobs recovery and pushed the July unemployment rate back up to 10.1 percent. The July spike in COVID-19 cases has subsided for now, but the high numbers of COVID-19 cases (even with no lockdown) can freeze the job market recovery.
HOUSEHOLD INCOME
According to 2018 ACS data, the various industries in the Tampa MSA provide a relatively low median household income of $54,912, ranking the metro 204th in the country. Incomes are nearly $10,000 below the national median income of $63,688.
The Keystone, Odessa, Land O’ Lakes and Lutz areas to the north of the city and southeast in Lithia have the highest incomes of the metro, all above $80,000. Metro incomes have enjoyed a 5.1 percent increase vs. 2017 and nearly a 20 percent increase (up $9,000) over the 2013 household income of $45,880.
Information and statistics from the Bureau of Labor Statistics employment data, Department of Labor report, Census/ACS Tables and RentRange® data sources.
VALUES –VS– INCOME
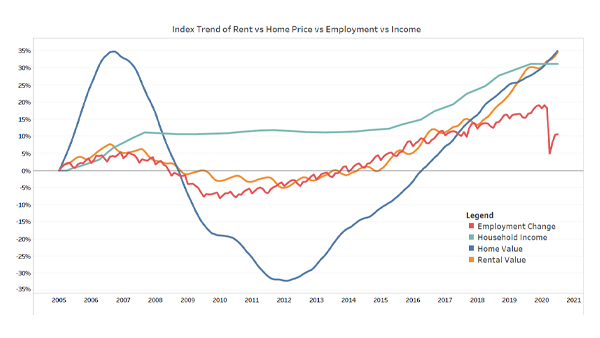
The multi-index trend shows the sharp ramp and decline of home values in the Tampa MSA, which peaked in August 2006 and bottomed in spring of 2012 (blue line). The Tampa market was one of the most severely affected markets in the last recessionary period, cutting home values in half between the peak and lows. However, since the lows in 2012, the market has again doubled in price and recently surpassed the 2006 peak.
Rental rates for three-bedroom single-family homes decreased -15 percent over the recessionary period (orange line). In 2015, the rental market accelerated, rising an average of six percent per year. In the last 2.5 years, SFR rents have increased to 8.5 percent annually and have decoupled from the employment and wage trends.
Income growth has been strong in the last five years at four percent year-over-year (YoY), but it’s beginning to flatten (teal line). Employment/job recovery recovered over 1/3 of the jobs lost since the lows in April, but it flatlined in July (red line). Slow economic recovery will put a drag on rent and home prices if the recovery remains muted.
HOME PRICE AND INVENTORY
Coming into 2020, Tampa SFR home prices have been rapidly appreciating, supported by low housing inventory, population increases, steady job growth, and wage increases. As of July 2020, the median single-family home value in the Tampa MSA was just above $270,000, an eight-year increase of 98 percent and averaging over 11 percent YoY growth since 2012. For those who bought at the height of the market in 2007 and held on, the median home price has just recently breached the previous peak.
The Tampa MSA ranked 8th for 2019 single-family construction permits. The Census Building Permit Survey shows 23,000 total unit permits and 14,600 SFR permits in 2019. The market was oversaturated with new construction before the housing crash, and builders slashed production to less than half of the historical average between 2007-2016. From 2017 forward, builders have been adding inventory at or above historical average. Currently, steady population gains and below average construction rates has resulted in a substantially under-built market. Construction output is finally increasing, but will take time to catch up.
Tampa MSA Home Price Forecast
The demand spurred by historically low interest rates and comparatively high rental prices will continue to motivate buyers to compete for reduced inventory supply into the fall and winter. If a new stimulus package is introduced, this could provide the additional capital for a down payment and drive another surge in new-buyer demand.
Forbearance policies have been extended through the end of the year, which contributes to the inventory shortage by limiting the natural turnover of resale inventory. For-sale supply is down over 30% YoY as of July, and home prices will remain supported given the extra demand for limited inventory.
Risks include increasingly tighter lending restrictions, a slow (or reversing) recovery for the job market, new-buyer attrition, and increasing defaults from non-GSE loans.
2020 (H2) SFR Housing Price Forecast: +1% to +3%
In January 2021, the housing market could implode… or not! At the turn of the year, forbearance and eviction programs are set to expire. This is unlikely to happen, as a huge flood of defaults would hammer banks and servicers while eviction filings overwhelm the courts. Opening the floodgates also has the undesirable side effect of kicking people out on the street in the middle of winter. Regardless of the administration, there will likely be new policy extensions, or new rules to start processing the backlog of non-paying borrowers and renters in a tiered manner.
Outside of the above, 2021 Tampa home prices should remain stable and even increase.
Mortgage interest rates are predicted to remain low through next year and have made mortgage payments cheaper to buy than rent.
If COVID outbreaks remain controlled, the job market can have a faster recovery. Real (non-stimulus) income will stay flat or decrease slightly as the economy ramps up. Any dip in prices should encourage demand from both homebuyers and investors
Risks for 2021 include variability around expiring forbearance and eviction policies. Extended eviction protection is putting smaller landlords in a tough spot and could cause a spike in distressed properties. Once the consumer protections expire, spikes in foreclosures and evictions will have a negative effect on prices.
2021 SFR Housing Price Forecast: +2% to +6%
Disclaimer: The variability around this forecast is wide and dependent upon data available as of July 2020. The severity and duration of the COVID-19 epidemic, as well as the response of the public and policymakers, continues to change daily.
RENTAL RATES
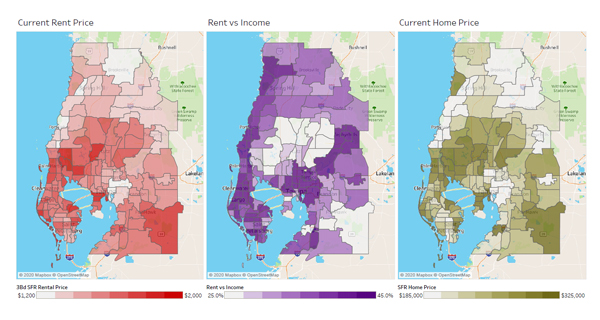
As of July 2020, the median three-bedroom, SFR home in the Tampa MSA is $1,670/mo. Across the metro, ZIP-code level three-bedroom SFR rents have a range of $1,200 to $2,100. Tampa ranks 21st in 5-year SFR price appreciation, with rent prices increasing nearly 30 percent. Landlords have gotten overzealous in the last two years, increasing over 15 percent.
Aggressive rent increases over the last several years has placed Tampa as the 13th most expensive rent-to-income ratio of 35.4 percent. Many areas near central Tampa and along the coast range between 35 percent and 45 percent. Rent prices in many areas are higher than ownership costs, which will reduce rental demand as renters convert to owners.
The CDC has halted residential evictions through the end of 2020. The eviction moratorium is reducing rental inventory on the market and causing rents to continue rising. Month-over-month rental increases for SFR and multifamily are leveling off per data from July.
WHERE DO RENTS GO FROM HERE?
Tampa Rental Rates Forecast
Rent prices were overheating before the pandemic and are beginning to slow. The aggressive price increases have increased the rental listing days on market by 18 percent YoY through July.
Rental market risks stem from the large number of lower-income jobs affected by the spiking unemployment (primarily renter cohort), and tenants are struggling to keep up with payments. Mid to high-priced rentals will see a drop in demand and price as many areas are less expensive to own than rent. Demand will stay elevated for SFR rentals as families relocate from cramped multifamily structures.
Unemployment may remain elevated through the end of the year, reducing the number of qualified tenants and putting further downside pressure on rents.
2020 SFR Rent Price Forecast: -5% to +0%
Our 2021 rental forecast has several unpredictable variables in play. Once the eviction moratorium is lifted, this could lead to a significant number of vacancies and a surge in available rental inventory.
Additionally, the number of “qualified” renters with no eviction or recent job loss will be significantly reduced. Landlords will likely have to lower their requirements to fill vacancies.
At the same time, renters in a good financial position are converting to buyers, further reducing rental demand.
Similar to the previous recessionary period, SFR rental rates may stagnate or drop lower until employment and wages recover. If the virus issues abate and all segments of businesses can return to full capacity, this will keep a floor under rental prices. For the market to support higher rents, wages not only need to recover, but also increase above current levels, which could take several years.
2021 SFR Rent Price Forecast: -10% to 0%
CONCLUSIONS
The Tampa single-family investment market has been a great choice for many years. It has been a favorite target for investors since the last recession for several reasons, including strong equity and income appreciation supported by rising population, job growth, and wage increases.
Investors currently looking at Tampa should be cautious with forward-looking rental income estimates due to an overheated rental market and high unemployment. Rent prices were already expensive before pandemic effects stalled the economy, and low interest rates have created an environment where it is cheaper to own than rent for many sectors of the market.
After seeing value appreciation double over the last eight years, home prices are still moderately priced vs other markets. Even if there is a moderate pullback in the next 1-2 years, we don’t foresee a meltdown like the last recession. Owners have a record amount of equity built up, and a myriad of government programs to work with borrowers and mitigate another foreclosure crisis.
Bottom line, the Tampa SFR rental market has good fundamentals, but needs a cooling period for the economy to realign. Cash-flow investors can still find deals in the market, but it would be wise to factor in a decrease in rental income for 1-2 years to make sure the numbers pencil on your next investment property.
Fred Heigold III is the senior data analyst at Altisource® / RentRange®, an industry leader in market data and analytics for the single-family rental housing industry.


0 Comments