
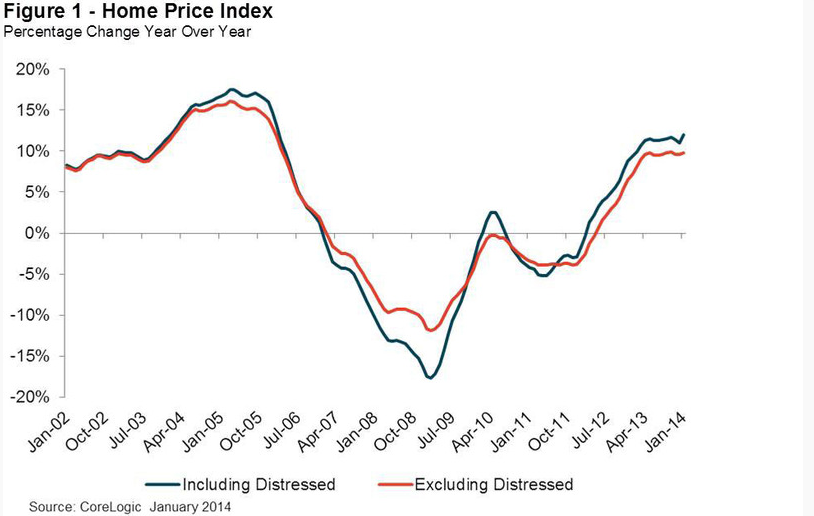
Home prices across the country increased 12 percent in January of this year compared to January 2013, marking 23 months of consecutive year-over-year increases in home prices nationally, according to a release from CoreLogic.
“The last time January month-over-month and year-over-year price appreciation was this strong was at the height of the housing bubble in 2006,” Dr. Mark Fleming, chief economist for CoreLogic, said in a release.
At the state level, including distressed sales, Louisiana, Nebraska and Texas surpassed their previous home price peaks in January 2014. In all, 22 states and the District of Columbia are at or within 10 percent of their peak home price appreciation. Additionally, over the past year, seven states equaled or grew faster than the nation as a whole, including Nevada, California, Oregon, Michigan, Georgia, Arizona and Florida.
Excluding distressed sales, home prices nationally increased 9.8 percent in January 2014 compared to January 2013 and 0.7 percent month over month compared to December 2013. Distressed sales include short sales and real estate owned (REO) transactions.
CoreLogic is a residential property information, analytics and services provider.
The CoreLogic Pending Home Price Index indicates that February 2014 home prices, including distressed sales, are projected to increase 12.5 percent year over year from February 2013. On a month-over-month basis, home prices are expected to increase 0.7 percent from January 2014 to February 2014. Excluding distressed sales, February 2014 home prices are poised to rise 10.4 percent year over year from February 2013 and 1.1 percent month over month from January 2014. The CoreLogic Pending HPI is a proprietary and exclusive metric that provides the most current indication of trends in home prices. It is based on Multiple Listing Service (MLS) data that measures price changes for the most recent month.
“Polar vortices and a string of snow storms did not manage to weaken house price appreciation in January,” Fleming said.
“Home prices continued to march higher in January and we expect to see more increases as
the market comes out of hibernation for the spring buying season,” Anand Nallathambi, president and CEO of CoreLogic, said in a release. “Excluding distressed sales, all 50 states and the District of Columbia showed year-over-year home price appreciation for January.” Click on the chart to enlarge.
Highlights as of January 2014:
- Including distressed sales, the five states with the highest home price appreciation were Nevada (+22.2 percent), California (+20.3 percent), Oregon (+14.3 percent), Michigan (+13.7 percent) and Georgia (+13.4 percent).
- Including distressed sales, only Mississippi (-0.3 percent) posted home price depreciation in January 2014.
- Excluding distressed sales, the five states with the highest home price appreciation were Nevada (+17.2 percent), California (+16.0 percent), Florida (+12.7 percent), Arizona (+11.5 percent) and Oregon (+11.4 percent).
- Excluding distressed sales, no states posted home price depreciation in January.
- Including distressed transactions, the peak-to-current change in the national HPI (from April 2006 to January 2014) was -17.3 percent. Excluding distressed transactions, the peak-to-current change in the HPI for the same period was -13.3 percent.
- The five states with the largest peak-to-current declines, including distressed transactions, were Nevada (-40.1 percent), Florida (-36.4 percent), Arizona (-30.8 percent), Rhode Island (-30.5 percent) and West Virginia (-28.9 percent).
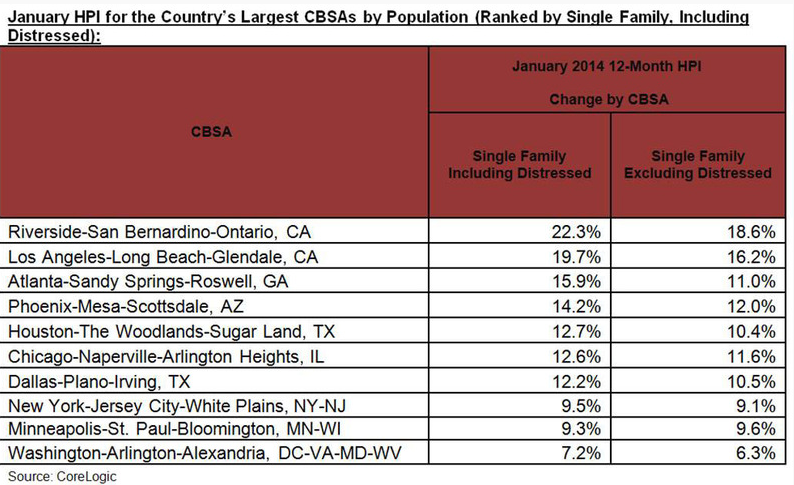
- Ninety-seven of the top 100 Core Based Statistical Areas** (CBSAs) measured by population showed year-over-year increases in January 2014. The three CBSAs that did not show an increase were New Haven-Milford, CT, Philadelphia, PA. and Rochester, NY.
*December data was revised. Revisions with public records data are standard, and to ensure accuracy, CoreLogic incorporates the newly released public data to provide updated results.
**The Office of Management and Budget (OMB) issued a bulletin on Feb. 28, 2013, establishing revised Core Based Statistical Area (CBSA) delineations. These new delineations are reflected in this data.
![]()


0 Comments