

ATTOM Data Solutions’ recently released Q3 2016 U.S. Home Sales Report shows distressed home sales at a nine-year low. Cash share sales also are at a nine-year low, while the average home price gain realized by sellers is at a nine-year high. ATTOM Data Solutions is the nation’s leading source for comprehensive housing data and the new parent company of RealtyTrac.
Distressed home sales — including bank-owned (REO) sales, sales of homes actively in foreclosure, and short sales — accounted for 12.9 percent of all U.S. single-family home and condo sales in Q3 2016, down from 15.0 percent in the previous quarter and down from 15.9 percent in Q3 2015 to the lowest share of distressed home sales since Q3 2007, when distressed sales accounted for 12.3 percent of all home sales.
The peak in share of distressed sales was Q1 2009 at 43.9 percent of all U.S. single-family home and condo sales.
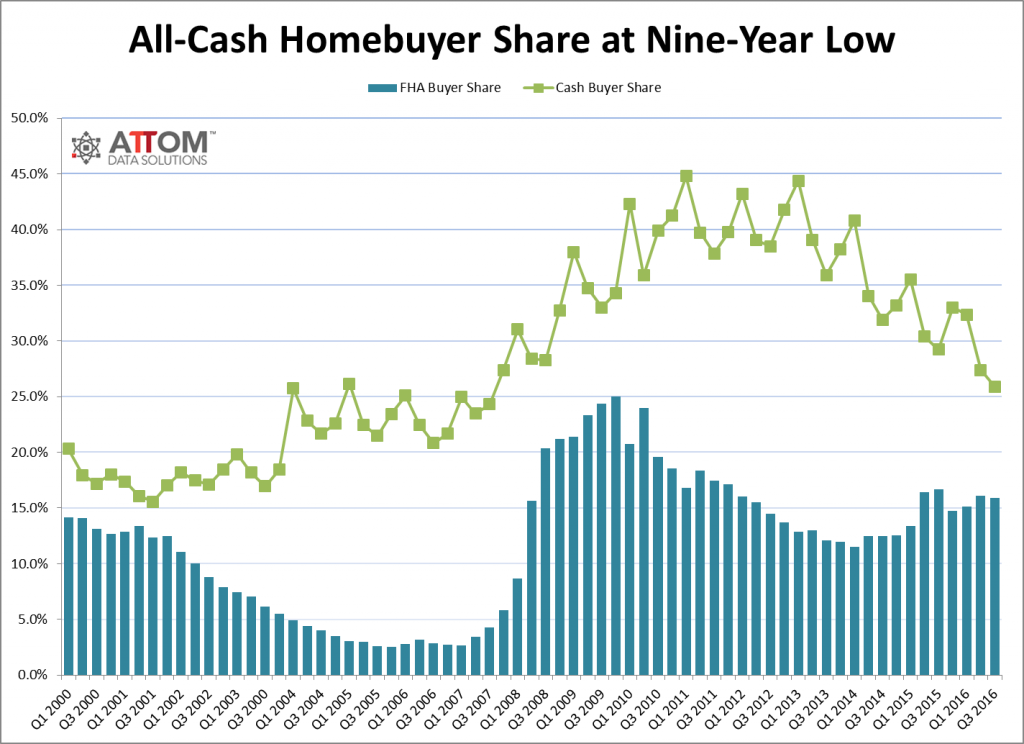
The report also shows that all-cash purchases accounted for 25.9 percent of all single-family home and condo sales in Q3 2016, down from 27.4 percent in the previous quarter and down from 29.2 percent in Q3 2015 to the lowest level since Q3 2007, when all-cash purchases accounted for 24.3 percent of all home sales.
The peak in share of all-cash purchases was Q1 2011 at 44.8 percent of all U.S. single-family home and condo sales.
“Distressed inventory for sale is virtually non-existent in many of the nation’s hottest housing markets, and when a distressed property is listed for sale in those markets it often sells quickly and at little or no discount,” said Daren Blomquist, senior vice president at ATTOM Data Solutions. “The scarcity of discounted distressed inventory is chasing away cash buyers and other bargain hunters, but it’s certainly good news for home sellers, who nationwide realized the biggest home price gains since purchase in nine years.
“We are seeing the average seller home price gain since purchase start to wane in some of the highest-priced markets where appreciation is beginning to cool, indicating those markets are past their prime as sellers’ markets,” Blomquist continued. “Meanwhile, there are still a number of buyers’ markets across the country where a high level of lingering distress and relatively weak demand from owner-occupant buyers provides investors with plenty of bargain-buying opportunities.”
Biggest home seller gains
Nationwide, homeowners who sold in Q3 2016 sold for an average of $43,000 above their purchase price, a 23 percent average home price gain since purchase — the highest since Q3 2007.
To view an interactive heat map showing Q3 2016 home seller gains, click here.
Among 118 metropolitan statistical areas with at least 1,000 single-family and condo sales in the third quarter, those with the highest average home price gain since purchase for home sellers in Q3 2016 were San Jose (68 percent); San Francisco (67 percent); Portland (51 percent); Seattle (51 percent); and Los Angeles (49 percent).
Two of those top five markets — San Francisco and San Jose — saw the average home price gain since purchase decline after peaking in the previous quarter.
“Seattle clearly stands out as a housing market that continues to outperform the vast majority of markets in the U.S. relative to price appreciation,” said Matthew Gardner, chief economist at Windermere Real Estate, covering the Seattle market. “This can be attributed to its booming economy and inventory limitations, which are largely a result of the region’s topographic and governmental constraints regarding land.
“The Seattle region remains staunchly a sellers’ market and this will likely not change until next year, at which point, I expect to see an increase in resale listings and new construction development,” Gardner continued. “However, despite this supply of new inventory, Seattle area home prices are still expected to outperform the rest of the U.S. in 2017.”

Five markets with lost home value
Homeowners who sold in Q3 2016 realized an average loss in home price since purchase in five of the 118 markets analyzed (4 percent): Huntsville, Alabama (5 percent loss); Mobile, Alabama (4 percent loss); Greensboro-High Point, North Carolina (2 percent loss); Augusta, Georgia (2 percent loss); and Winston-Salem, North Carolina (1 percent loss).
There were five additional markets analyzed where the average profit since purchase for homeowners who sold in Q3 2016 was 3 percent or less: Dayton, Ohio (0 percent); Columbia, South Carolina (0 percent); Baton Rouge, Louisiana (1 percent); Cleveland, Ohio (1 percent); and Little Rock, Arkansas (3 percent).
Highest share of distressed sales
Among metropolitan statistical areas with at least 1,000 single family home and condo sales in Q3 2016, those with the highest share of distressed sales in Q3 2016 were Toledo, Ohio (36.4 percent); Tucson, Arizona (24.4 percent); Rockford, Illinois (23.8 percent); Las Vegas (20.9 percent); and Lakeland-Winter Haven, Florida (20.1 percent).
Other markets where distressed sales accounted for more than 15 percent of all single family home and condo sales in Q3 2016 included Chicago, Orlando, Miami, Tampa, Memphis, Baltimore, Jacksonville (Florida), Cleveland, Virginia Beach, and New York.

Lowest share of distressed sales
Metro areas with the lowest share of distressed sales in Q3 2016 were Anchorage, Alaska (3.7 percent); Austin, Texas (4.2 percent); Boulder, Colorado (4.6 percent); Asheville, North Carolina (5.4 percent); and Springfield, Missouri (5.7 percent).
Other markets where the share of distressed sales accounted for less than 10 percent of all sales included Dallas, San Antonio, Houston, Denver, San Jose, Nashville, Pittsburgh, Seattle, San Francisco, and Minneapolis-St. Paul.
Biggest bank-owned discounts
The median price of a bank-owned (REO) home in Q3 2016 was $131,500, 43 percent below the overall median price for all homes — up from a 42 percent discount in the previous quarter but equal to the 43 percent REO discount in Q3 2015.
Metro areas with the biggest REO discount in Q3 2016 were Pittsburgh (67 percent); Toledo, Ohio (66 percent); Memphis (63 percent); Birmingham, Alabama (62 percent); and Philadelphia (62 percent).
Other markets with an REO discount of more than 45 percent in Q3 2016 included Milwaukee, Rochester (New York), Columbus (Ohio), Cleveland, New York, Detroit, St. Louis, Cincinnati, and Baltimore.
Smallest bank-owned discounts
Metro areas with the smallest REO discount in Q3 2016 were Austin, Texas (0 percent); Boulder, Colorado (7 percent); Provo-Orem, Utah (8 percent); Boise, Idaho (9 percent); and Denver (10 percent).
Other markets where the REO discount in Q3 2016 was below 20 percent included San Diego, Salt Lake City, San Jose, Indianapolis, San Antonio, Houston, Phoenix, Las Vegas and Los Angeles.
To view a map of where to find distressed property discounts, click here.
40 percent of local markets reach milestone
Nationwide, single-family homes and condos sold for a median price of $230,000 in Q3 2016, up 6 percent from the previous quarter and up 10 percent from a year ago to a new all-time high in home prices — 1 percent above the pre-recession peak of $227,000 in Q3 2005. Since bottoming out in Q1 2012, national median home prices have risen 60 percent.
Out of 118 metropolitan statistical areas analyzed in the report, 47 (40 percent) reached new all-time home price peaks in Q3 2016, including Dallas, Atlanta, Detroit, Seattle, Minneapolis, St. Louis, Baltimore, Pittsburgh, Portland and San Antonio.
Metro areas with the biggest year-over-year increase in median sales prices in Q3 2016 were Jacksonville, Florida (up 24 percent); Tampa-St. Petersburg, Florida (up 17 percent); Palm Bay-Melbourne-Titusville, Florida (up 17 percent); Chicago (up 17 percent); and Pensacola, Florida (up 15 percent).
Highest share of cash buyers
Among metropolitan statistical areas with at least 1,000 single-family and condo home sales in Q3 2016, those with the highest share of all-cash purchases were Raleigh, North Carolina (53.1 percent), Miami (45.8 percent); Naples, Florida (45.2 percent); Ocala, Florida (44.9 percent); and North Port-Sarasota-Bradenton, Florida (43.2 percent).
FHA buyer share declines
Nationwide, buyers using loans backed by the Federal Housing Administration (FHA) accounted for 15.9 percent of all single-family and condo home sales in Q3 2016, down from 16.1 percent in Q2 2016 and down from 16.7 percent a year ago. The FHA share of buyers has declined on a year-over-year basis for two consecutive quarters nationwide following seven consecutive quarters of year-over-year increases.
Among metropolitan statistical areas with at least 1,000 single-family and condo sales in Q3 2016, those with the highest share of FHA buyers were Ogden-Clearfield, Utah (35.5 percent); Indianapolis (31.6 percent); Salt Lake City (28.5 percent); Albuquerque, New Mexico (27.5 percent); and Riverside-San Bernardino, California (26.4 percent).
Institutional Investor share increases
Nationwide, institutional investors (entities purchasing at least 10 homes in a calendar year) accounted for 2.7 percent of all single-family and condo home sales in Q3 2016, up from 2.6 percent in the previous quarter and up from 2.2 percent a year ago. It was the second consecutive quarter where the institutional investor share of sales increased from a year ago following 11 consecutive quarters of year-over-year decreases.
Among metropolitan statistical areas with at least 1,000 total sales in Q3 2016, those with the highest share of institutional investor purchases were Memphis (12.3 percent); Birmingham, Alabama (9.0 percent); Lakeland-Winterhaven, Florida (7.5 percent); York-Hanover, Pennsylvania (5.9 percent); and Tulsa, Oklahoma (5.6 percent).
Report methodology
The RealtyTrac U.S. Home Sales Report provides percentages of distressed sales and all sales that are sold to investors, institutional investors and cash buyers, a state and metropolitan statistical area. Data is also available at the county and ZIP code level upon request. The data is derived from recorded sales deeds, foreclosure filings and loan data. Statistics for previous quarters are revised when each new report is issued as more deed data becomes available for those previous months. Median sales price is calculated based on the sales price on the publicly recorded sales deed when available. If no sales price is recorded then the purchase loan amount is used to calculate median price, and if no purchase loan amount is available, the property’s Automated Valuation Model (AVM) at time of sale is used to calculate the median price.
About ATTOM Data Solutions
ATTOM Data Solutions is the curator of the ATTOM Data Warehouse, a multi-sourced national property database that aggregates property tax, deed, mortgage, foreclosure, environmental risk, natural hazard, health hazards, neighborhood characteristics and other property characteristic data for more than 150 million U.S. properties. The ATTOM Data Warehouse delivers actionable data to businesses, consumers, government agencies, universities, policymakers and the media in multiple ways, including bulk file licenses, APIs and customized reports.
ATTOM Data Solutions also powers consumer websites designed to promote real estate transparency: RealtyTrac.com is a property search and research portal for foreclosures and other off-market properties; Homefacts.com is a neighborhood research portal providing hyperlocal risks and amenities information; HomeDisclosure.com produces detailed property pre-diligence reports.
ATTOM Data and its associated brands are cited by thousands of media outlets each month, including frequent mentions on CBS Evening News, The Today Show, CNBC, CNN, FOX News, PBS NewsHour and in The New York Times, Wall Street Journal, Washington Post, and USA TODAY.


0 Comments