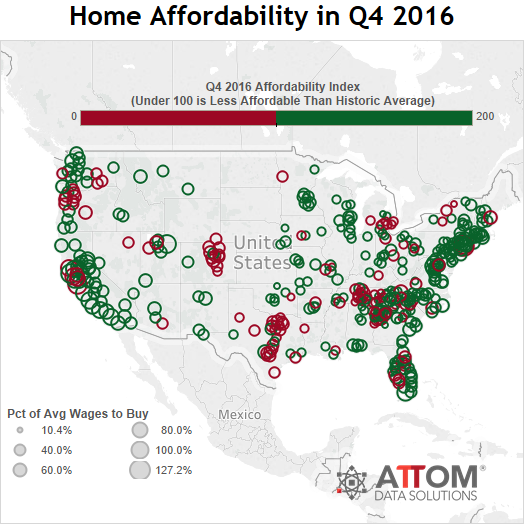
The Home Affordability Index, which shows national affordability of housing, shares that Q4 2016 was at its lowest level since Q4 2008. The report, issued by ATTOM Data Solutions, parent company of Realty Trac, shows that 29 percent of the U.S. county housing markets were less affordable than their historic affordability averages in the fourth quarter, up from 24 percent of markets in the previous quarter and up from 13 percent of markets a year ago to the highest share since Q3 2009 — when 47 percent of markets were less affordable than their historic affordability averages.
The report analyzed median home prices derived from publicly recorded sales deed data collected by ATTOM Data Solutions and average wage data from the U.S. Bureau of Labor Statistics in 447 U.S. counties with a combined population of more than 184 million. The affordability index is based on the percentage of average wages needed to make monthly house payments on a median-priced home with a 30-year fixed rate and a 3 percent down payment — including property taxes and insurance. An index of 100 indicates market affordability on par with historical norms while above 100 indicates more affordable than historic norms and below 100 indicates less affordable than historic norms.
Nationally, the affordability index in the fourth quarter was 103, down from 108 in the previous quarter and down from 116 a year ago to the lowest level since Q4 2008, when the national home affordability index was 102.
“Rapid home price appreciation and tepid wage growth have combined to erode home affordability during this housing recovery, and the recent uptick in mortgage rates only accelerated that trend in the fourth quarter,” said Daren Blomquist, senior vice president at ATTOM Data Solutions. “The prospect of further interest rate hikes in 2017 will likely cause further deterioration of home affordability next year. Absent a strong resurgence in wage growth, that will put downward pressure on home price appreciation in many local markets.”
Less Affordable Counties Than Their Historic Norms
Out of the 447 counties analyzed in the report, 130 counties (29 percent) had an affordability index below 100, indicating they are less affordable than their historic norms.
Counties with the lowest affordability index in Q4 2016 were Cumberland County, Tennessee, in the Crossville metro area (58); Genesee County, Michigan, in the Flint metro area (77); Denver County, Colorado (79); Adams County, Colorado, in the Denver metro area (81); and Wilson County, Tennessee, in the Nashville metro area (83).
The most populated counties that were less affordable than their historic norms in Q4 2016 included Kings County (Brooklyn), New York (affordability index of 91); Dallas County, Texas (91); Queens County, New York (95); Tarrant County, Texas, also in the Dallas metro area (93); and Alameda County, California, in the San Francisco metro area (93).
Home Price Growth Outpaced Wage Growth
Annual home price growth outpaced annual wage growth in 363 of 447 counties (81 percent) analyzed in the report, up from 77 percent of counties in the previous quarter and up from 57 percent of counties a year ago.
Since bottoming out in Q1 2012, the national median home price has increased 60 percent while average weekly wages have increased just 1 percent during that same timeframe.
The most populated counties where home price growth outpaced wage growth were Los Angeles County, California; Harris County, Texas, in the Houston metro area; Maricopa County, Arizona, in the Phoenix metro area; San Diego County, California; Orange County, California; Miami-Dade County, Florida; Kings County, New York; and Dallas County, Texas.
Counties with the strongest annual growth in average weekly wages were Woodbury County, Iowa in the Sioux City metro area (15 percent); Maury County, Tennessee, in the Nashville metro area (14 percent); Iredell County, North Carolina, in the Charlotte metro area (11 percent); Walton County, Georgia, in the Atlanta metro area (9 percent); Elkhart County, Indiana, in the Elkhart metro area (8 percent); and King County, Washington, in the Seattle metro area (8 percent).
Affordability Improves in Some Markets
Home affordability improved compared to a year ago in 81 of the 447 counties analyzed (18 percent), down from 39 percent of counties with improving affordability in the previous quarter and down from 26 percent of counties with improving affordability in Q4 2015.
The most populated counties with improving home affordability in Q4 2016 compared to a year ago were Suffolk County (Long Island), New York; Bronx County, New York; Fairfax County, Virginia, in the Washington, D.C. metro area; Fulton County, Georgia, in the Atlanta metro area; and Fairfield County, Connecticut.
The most populated counties with worsening affordability in Q4 2016 compared to a year ago were Los Angeles County, California; Harris County, Texas, in the Houston metro area; Maricopa County, Arizona, in the Phoenix metro area; San Diego County, California; and Orange County, California.
The Top Least Affordable Markets by Share of Wages
On average across the 447 counties analyzed, average wage earners need to spend 36.9 percent of their income to buy a median-priced home, still below the historic average of 39.1 percent but up from 36.6 percent in the previous quarter and up from 35.2 percent a year ago.
Counties that were least affordable by this absolute affordability standard were Kings County (Brooklyn), New York (127.2 percent of average wages needed to buy a median priced home); Santa Cruz County, California (113.7 percent); Marin County (San Francisco), California (111.9 percent); Summit County (Summit Park), Utah (105.3 percent); and New York County (Manhattan), New York (102.6 percent).
Other counties in the top 10 least affordable were San Francisco County, California (95.9 percent); Kauai County, Hawaii (94.3 percent); San Luis Obispo County, California (90.4 percent); Maui County, Hawaii (88.8 percent); and Monroe County (Key West), Florida (88.8 percent).
Counties that were most affordable by this absolute standard were Clayton County (Atlanta), Georgia (10.4 percent of average wages needed to buy a median-priced home); Roane County (Knoxville), Tennessee (11.8 percent); Bay County (Bay City), Michigan (13.0 percent); Bibb County (Macon), Georgia (13.3 percent); and Richmond County (Augusta), Georgia (14.0 percent).

Click image for larger graph. Image will open in new tab.

Click on image for larger graph. Image will open in new tab.
You can read the full report by clicking HERE.
About ATTOM Data Solutions
ATTOM Data Solutions is the curator of the ATTOM Data Warehouse, a multi-sourced national property database that blends property tax, deed, mortgage, foreclosure, environmental risk, natural hazard, health hazards, neighborhood characteristics and other property characteristic data for more than 150 million U.S. residential and commercial properties. The ATTOM Data Warehouse delivers actionable data to businesses, consumers, government agencies, universities, policymakers and the media in multiple ways, including bulk file licenses, APIs and customized reports.
ATTOM Data and its associated brands are cited by thousands of media outlets each month, including frequent mentions on CBS Evening News, The Today Show, CNBC, CNN, FOX News, PBS NewsHour and in The New York Times, Wall Street Journal, Washington Post, and USA TODAY.


0 Comments