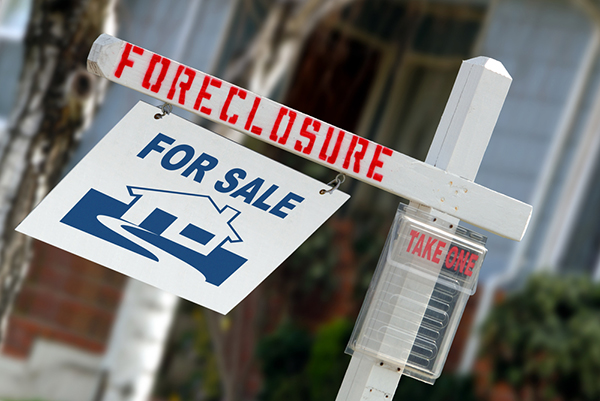
Although foreclosure starts are still falling midway through 2018, the rates are actually rising in 40% of local markets according to ATTOM Data Solutions’ Midyear 2018 U.S. Foreclosure Market Report. The report indicated a total of 362,275 U.S. properties with foreclosure filings. Those filings include default notices, scheduled auctions, and bank repossessions. Not every filing ultimately results in a foreclosure, but the rate of filing is a good indicator of foreclosure trends both present and future.
The midyear number is down 15% from the same measure in 2017 and 78% from that measure in 2010. However, 26 of the 219 metropolitan statistical areas (MSAs) analyzed in the report posted year-over-year increases in foreclosure starts. Daren Blomquist, senior vice president with ATTOM Data Solutions, observed, “Localized foreclosure flare-ups in the first half of 2018 can no longer be blamed on legacy distress left over from the last housing bubble.” He added, “Instead, these local foreclosure increases are typically the result of more recent distress triggers in those markets.”
3 Worst States for Foreclosure
According to the report, the three states with the highest foreclosure rates in the United States are:
- New Jersey (0.80%)
- Delaware (0.57%)
- Maryland (0.50%)
Nationwide, the foreclosure rate was 0.27%, or about one in every 370 houses. Among the MSAs analyzed, Atlantic City, New Jersey (1.48%); Trenton, New Jersey (0.96%); and Flint, Michigan (0.95%), posted the highest foreclosure rates in the country.
On a statewide level, New Jersey’s foreclosure filing rates are actually down about 2% from a year ago. “The decrease isn’t enough to erase New Jersey’s unfortunate distinction as the foreclosure leader,” observed New Jersey 101.5 reporter Dino Flammia. He also noted nearly half of New Jersey’s foreclosure filings are still linked to loans that originated between 2004 and 2008 and 8.6% of Atlantic City’s foreclosure filings were from 2014 FHA loans (compared to 1.28% nationwide).















0 Comments