

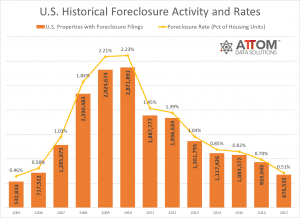
ATTOM Data Solutions, today released its Year-End 2017 U.S. Foreclosure Market Report, which shows foreclosure filings — default notices, scheduled auctions and bank repossessions — were reported on 676,535 U.S. properties in 2017, down 27 percent from 2016 and down 76 percent from a peak of nearly 2.9 million in 2010 to the lowest level since 2005.
Those 676,535 properties with foreclosure filings in 2017 represented 0.51 percent of all U.S. housing units, down from 0.70 percent in 2016 and down from a peak of 2.23 percent in 2010 to the lowest level since 2005.
Click on graph for larger image. Graph will open in separate tab.
ATTOM’s year-end foreclosure report is a count of unique properties with a foreclosure filing during the year based on publicly recorded and published foreclosure filings collected in more than 2,500 counties nationwide, with address-level data on more than 23 million foreclosure filings historically also available for license or customized reporting. See full methodology below.
The report also includes new data for December 2017, when there were 64,651 U.S. properties with foreclosure filings, up 1 percent from the previous month but still down 25 percent from a year ago — the 27th consecutive month with a year-over-year decrease in foreclosure activity.
“Thanks to a housing boom driven primarily by a scarcity of supply, which has helped to limit home purchases to the most highly qualified — and low-risk — borrowers, the U.S. housing market has the luxury of playing a version of foreclosure limbo in which it searches for how low foreclosures can go,” said Daren Blomquist, senior vice president at ATTOM Data Solutions. “There are a few notable local market exceptions playing a different version of foreclosure limbo in which a backlog of legacy foreclosure activity left over from the last housing crisis is still winding its way through a labyrinthine foreclosure process, resulting in incongruous jumps in various stages of foreclosure activity in markets such as New York, New Jersey and DC.”

Click on map for larger image. Interactive map will open in separate tab.
Foreclosure Starts at New Record Low Nationwide
Lenders started the foreclosure process on 383,701 U.S. properties in 2017, down 20 percent from 2016 and down 82 percent from a peak of 2,139,005 in 2009 to a new all-time low going back as far as foreclosure start data is available — 2006.
“Across Southern California, while foreclosures have maintained historically low levels during much of 2017, housing affordability has become the concern that has many watching the market for a potential shift in the near future,” said Michael Mahon, president of First Team Real Estate, covering the Southern California market, which also posted an 11-year low in foreclosure starts in 2017. “With wage growth not meeting equity growth across many Southern California markets — coupled with rising interest rates — there are some concerns that foreclosures could be on the rise in 2018.”
Counter to the national trend, the District of Columbia and five states posted year-over-year increases in foreclosure starts in 2017, including Illinois (up 2 percent); Oklahoma (up 23 percent); Louisiana (up 2 percent); DC (up 54 percent); West Virginia (up 32 percent); and Vermont (up 27 percent).
New York Foreclosure Auctions at 11-Year High
A total of 318,165 U.S. properties were scheduled for public foreclosure auction (the same as a foreclosure start in some states) in 2017, down 27 percent from 2016 and down from a peak of 1,600,593 in 2010 to a new all-time low going back as far as foreclosure auction data is available — 2006.
“The data for the Seattle market tells a very big story, and that is we are not seeing a housing bubble forming,” said Matthew Gardner, chief economist at Windermere Real Estate, covering the Seattle market, where scheduled foreclosure auctions in 2017 dropped 47 percent to an 11-year low. “With foreclosure rates at less than 0.4 percent of total housing units, the market is remarkably stable. That said, we are certainly suffering from serious affordability issues, but this is not translating into defaults on loans.”
The District of Columbia and seven states posted a year-over-year increase in scheduled foreclosure auctions in 2017, including New York (up 9 percent to the highest level since 2006); Oklahoma (up 4 percent); Connecticut (up 7 percent); and Maine (up 2 percent).
New Jersey Bank Repossessions at 11-Year High
Lenders repossessed 291,579 properties through foreclosure (REO) in 2017, down 23 percent from 2016 and down 72 percent from a peak of 1,050,500 in 2010 to the lowest level since 2006 — an 11-year low.
Counter to the national trend, the District of Columbia and seven states posted a year-over-year increase in REOs in 217, led by New Jersey (19 percent increase to the highest level since 2006); Delaware (up 16 percent); Montana (up 12 percent); DC (up 10 percent); and Wyoming (up 10 percent).
Top State Foreclosure Rates in 2017
States with the highest foreclosure rates in 2017 were New Jersey (1.61 percent of housing units with a foreclosure filing); Delaware (1.13 percent); Maryland (0.95 percent); Illinois (0.86 percent); and Connecticut (0.78 percent).
Rounding out the top 10 states with the highest foreclosure rates were Florida (0.72 percent); South Carolina (0.70 percent); Ohio (0.70 percent); Nevada (0.67 percent); and New Mexico (0.63 percent).
Top Metro Foreclosure Rates in 2017
Among 217 metropolitan statistical areas with a population of at least 200,000, those with the highest foreclosure rates in 2017 were Atlantic City, New Jersey (2.72 percent of housing units with a foreclosure filing); Trenton, New Jersey (1.68 percent); Philadelphia, Pennsylvania (1.26 percent); Fayetteville, North Carolina (1.17 percent); and Rockford, Illinois (1.14 percent).
Rounding out the top 10 were Cleveland, Ohio (1.06 percent); Columbia, South Carolina (1.05 percent); Baltimore, Maryland (1.05 percent); Chicago, Illinois (1.04 percent); and Albuquerque, New Mexico (0.99 percent).
Average Time to Foreclose Jumps Above 1,000 Days Nationwide
U.S. properties foreclosed in the fourth quarter of 2017 had been in the foreclosure process an average of 1,027 days, a 14 percent jump from the previous quarter and a 28 percent increase from a year ago to the longest since ATTOM began tracking average foreclosure timelines in Q1 2007.
States with the longest average time to foreclose in Q4 2017 were Indiana (2,370 days); Nevada (1,933 days); Florida (1,493 days); New Jersey (1,298 days) and Georgia (1,263 days).
Among 233 counties nationwide with sufficient data, those with the longest average time to foreclose in Q4 2017 were Queens County, New York; Marion County (Indianapolis), Indiana (2,810 days); Orange County (Orlando), Florida (2,109 days); Henry County (Atlanta), Georgia (2,075 days); and Cherokee County (Atlanta), Georgia (1,988 days).
Biggest Backlogs of Legacy Foreclosures
Nationwide, 50 percent of all loans actively in foreclosure as of the end of 2017 were originated between 2004 and 2008 — down from 55 percent a year ago. States with the highest number of legacy foreclosures on loans originated between 2004 and 2008 were New York (25,886), New Jersey (20,172), Florida (19,494), California (9,847), and Illinois (8,732).
Legacy foreclosures on loans originated between 2004 and 2008 represented 74 percent of all active loans in foreclosure in the District of Columbia, higher than any state with at least 100 active loans in foreclosure, followed by Hawaii (67 percent), New Jersey (58 percent), Massachusetts (58 percent), Florida (55 percent), and Nevada (55 percent).
Counties with the highest total number of legacy foreclosures were Nassau County (Long Island), New York (6,782); Cook County (Chicago), Illinois (5,478); Kings County (Brooklyn), New York (4,677); Miami-Dade County, Florida (3,804); and Suffolk County (Long Island), New York (3,417).

Click on chart for larger image. Chart will open in separate tab.
Report methodology
The ATTOM Data Solutions Year-End U.S. Foreclosure Market Report provides a count of the total number of properties with at least one foreclosure filing entered into the ATTOM Data Warehouse during the year. Some foreclosure filings entered into the database during the year may have been recorded in the previous year. Data is collected from more than 2,500 counties nationwide, and those counties account for more than 90 percent of the U.S. population. ATTOM’s report incorporates documents filed in all three phases of foreclosure: Default — Notice of Default (NOD) and Lis Pendens (LIS); Auction — Notice of Trustee Sale and Notice of Foreclosure Sale (NTS and NFS); and Real Estate Owned, or REO properties (that have been foreclosed on and repurchased by a bank). For the annual and quarterly reports, if more than one type of foreclosure document is received for a property during the year or quarter, only the most recent filing is counted in the report. The annual, quarterly and monthly reports all check if the same type of document was filed against a property previously. If so, and if that previous filing occurred within the estimated foreclosure timeframe for the state where the property is located, the report does not count the property in the current year, quarter or month.
To read the original report, click here.


0 Comments