

ATTOM Data Solutions, released its Q2 2017 U.S. Residential Property Loan Origination Report, which shows more than 2 million (2,033,296) loans were originated on U.S. residential properties (1 to 4 units) in the second quarter of 2017, up 27 percent from a three-year low in the previous quarter but still down 12 percent from Q2 2016.
The loan origination report is derived from publicly recorded mortgages and deeds of trust collected by ATTOM Data Solutions in more than 1,700 counties accounting for more than 87 percent of the U.S. population. Counts and dollar volumes for the most recent quarter are projected based on available data at the time of the report (see full methodology below).
The report also found that 22.8 percent of all purchase loan originations on single-family homes in Q2 2017 involved co-borrowers — multiple, non-married borrowers listed on the mortgage or deed of trust — up from 21.3 percent in the previous quarter and up from 20.5 percent in Q2 2016.
“Homebuyers are increasingly relying on co-borrowers to help with home purchases, particularly in high-priced markets where sizable down payments are necessary to compete,” said Daren Blomquist, senior vice president at ATTOM Data Solutions. “This rising trend in co-borrowing is helping to eke out increases in purchase loan originations despite affordability and supply constraints.”

Click on image for larger map. Map will open in separate window.
Highest Share of Co-Borrowers
Among 42 cities with at least 1,500 purchase loan originations on single-family homes in the second quarter, those with the highest share of co-borrowers were San Jose, California (50.9 percent); Miami, Florida (45.2 percent); Seattle, Washington (39.1 percent); the Southern California cities of Los Angeles (31.1 percent) and San Diego (29.4 percent); and Portland, Oregon (28.8 percent).
“Climbing home prices are forcing more and more borrowers to consider other options, such as leveraging a parent’s credit, in order to qualify to buy,” said Matthew Gardner, chief economist at Windermere Real Estate, covering the Seattle market. “Given the ongoing concerns about the emergence of another housing bubble, it was encouraging to see that Seattle has the tenth highest average down payment in the U.S. at 14 percent. Such substantial down payments can act as a cushion in the unlikely event that home prices start to reverse the substantial gains that we’ve seen over the past several years.”
Cities with the lowest share of co-borrowers in the second quarter were Memphis, Tennessee (10.3 percent); Mesa, Arizona (12.5 percent); Oklahoma City, Oklahoma (14.2 percent); Gilbert, Arizona (14.4 percent); and Henderson, Nevada (15.1 percent).
Median Down Payment Percentage at Highest Level Since Q3 2014
The median down payment for single-family homes and condos purchased with financing in Q2 2017 was $18,850, 7.3 percent of the median price of the homes purchased. That 7.3 percent was up from 6 percent in the previous quarter and up from 5.9 percent in Q2 2016 to the highest level since Q3 2014, when it was 7.4 percent.

Click on image for larger graph. Graph will open in separate tab.
Among 75 metropolitan statistical areas with at least 1,500 financed purchases of single-family homes and condos in the second quarter, those with the highest median down payment percentage in Q2 2017 were San Jose, California (25.2 percent); San Francisco, California (22.3 percent); Los Angeles, California (19.3 percent); Naples, Florida (18.5 percent); and Oxnard-Thousand Oaks-Ventura, California (17.4 percent).
“Across Southern California, we are witnessing the prolonged effects of low listing inventory, creating greater competition among purchasers and transforming the methods of financing being utilized,” said Michael Mahon, president at First Team Real Estate, covering the Southern California market. “Higher competition among home purchasers, often times involved in multiple-offer situations, is hampering the abilities of potential borrowers to leverage low-down payment loans such as FHA and VA financing options. Borrowers with higher down payments or all cash represent less risk to a closed transaction and are therefore more appealing to sellers.”

Click on image for larger interactive map. Map will open in separate tab.
Share of FHA And VA Loans Drops from Year Ago
Loans backed by the Federal Housing Administration (FHA) accounted for 13.6 percent of all residential property loans originated in Q2 2017, up from 13.3 percent in the previous quarter but down from 14.1 percent in Q2 2016.
Loans backed by the U.S. Department of Veterans Affairs (VA) accounted for 6.5 percent of all residential property loans originated in Q2 2017, down from 6.6 percent in the previous quarter and down from 7.3 percent in Q2 2016.
Purchase Origination Dollar Volume Up To 10-Year High, Refi Dollar Volume Down
The total dollar volume of loan originations in the second quarter — including purchase, refinance and HELOC originations — was nearly $509 billion, up 31 percent from the previous quarter but still down 12 percent from a year ago.
The total dollar volume of purchase loan originations in the second quarter was nearly $257 billion, up 67 percent from the previous quarter and up 7 percent from a year ago to the highest level since Q2 2007 — a 10-year high.
The total dollar volume of refinance originations in the second quarter was more than $188 billion, up 1 percent from the previous quarter but still down 32 percent from a year ago.
The total dollar volume of HELOC originations in the second quarter was nearly $64 billion, up 30 percent from the previous quarter but still down 1 percent from a year ago.
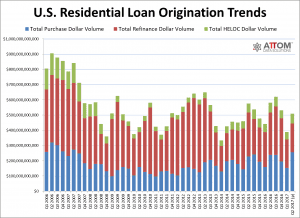
Click on image for larger graph. Graph will open in separate tab.
Biggest Purchase Origination Gains
Nationwide a total of 936,604 purchase loans secured by U.S. residential properties (1 to 4 units) were originated in the second quarter, up 60 percent from the previous quarter and up 2 percent from a year ago.
Among 104 metropolitan statistical areas analyzed in the report, those with the biggest year-over-year increase in the number of purchase loan originations in the second quarter were Fort Wayne, Indiana (up 38 percent); North Port-Sarasota-Bradenton, Florida (up 25 percent); Indianapolis, Indiana (up 24 percent); Des Moines, Iowa (up 22 percent); and Tampa, Florida (up 21 percent).
Among those same 104 metro areas, those with the biggest year-over-year decrease in purchase originations were Flint, Michigan (down 33 percent); Raleigh, North Carolina (down 32 percent); Charleston, South Carolina (down 26 percent); Lexington, Kentucky (down 23 percent); and Santa Rosa, California (down 22 percent).
Biggest Drops in Refinance Originations
Nationwide a total of 764,560 refinance loans secured by U.S. residential properties (1 to 4 units) were originated in the second quarter, up 1 percent from the previous quarter but still down 27 percent from a year ago.
Among 104 metropolitan statistical areas analyzed in the report, only five posted a year-over-year increase in refinance originations: Davenport-Moline-Rock Island in Illinois and Iowa (40 percent increase); Kansas City, Missouri (25 percent increase); Fort Wayne, Indiana (7 percent increase); Flint, Michigan (6 percent increase); and Canton, Ohio (5 percent increase).
Among those same 104 metro areas, those with the biggest year-over-year decrease in refinance originations were San Jose, California (down 57 percent); Honolulu, Hawaii (down 56 percent); Bridgeport, Connecticut (down 56 percent); Charleston, South Carolina (down 55 percent); and Raleigh, North Carolina (down 54 percent).
HELOCs Up
Nationwide a total of 332,132 Home Equity Lines of Credit (HELOCs) secured by U.S. residential properties (1 to 4 units) were originated in the second quarter, up 29 percent from the previous quarter but still down 4 percent from a year ago.
Among 104 metropolitan statistical areas analyzed in the report, those with the biggest year-over-year increase in HELOC originations were Wichita, Kansas (up 63 percent); Pensacola, Florida (up 37 percent); Salt Lake City, Utah (up 31 percent); Dallas-Fort Worth, Texas (up 27 percent); and Indianapolis, Indiana (up 26 percent).
To read the original report, click here.
Report methodology
ATTOM Data Solutions analyzed recorded mortgage and deed of trust data for single family homes, condos, townhomes and multi-family properties of two to four units for this report. Each recorded mortgage or deed of trust was counted as a separate loan origination. Dollar volume was calculated by multiplying the total number of loan originations by the average loan amount for those loan originations. Origination counts and dollar volumes are projected for the most recent quarter based on historical share of mortgage and deed of trust data recorded and collected within 45 days from the end of a quarter — which is when ATTOM pulls data for the report. Only metropolitan statistical areas with at least 75 percent of records historically collected within 45 days are analyzed in the report.
ATTOM Data Solutions
ATTOM Data Solutions is the curator of the ATTOM Data Warehouse, a multi-sourced national property database that blends property tax, deed, mortgage, foreclosure, environmental risk, natural hazards, health hazards, neighborhood characteristics and other property characteristic data for more than 150 million U.S. residential and commercial properties. The ATTOM Data Warehouse delivers actionable data to businesses, consumers, government agencies, universities, policymakers and the media in multiple ways, including bulk file licenses, APIs and customized reports.


0 Comments