

Foreclosure filings are rising again, up 32% year over year as of January, according to ATTOM, but this is not 2008.
The difference matters.
Today’s market isn’t being driven by systemic credit failure or collapsing home values. It’s being shaped by a very different set of pressures: higher carrying costs, longer hold times, and investors underwriting deals in a fundamentally different rate environment than the one they’re operating in today.
For investors, this isn’t a warning sign to pull back. It’s a signal to adjust because the opportunities emerging in this cycle will favor those who understand what’s actually driving the numbers, not just reacting to them.
According to ATTOM’s January 2026 U.S. Foreclosure Market Report, 40,534 properties had foreclosure filings that month, with starts up 26% and completed foreclosures rising nearly 59% year over year. Those increases are real but they are not systematic. Overall activity remains well below historic peaks, and most homeowners are still on stable footing.
Across our portfolio, this is not broad-based distress. It’s concentrated pressure: expiring forbearance programs, elevated carrying costs, and investor-driven delinquencies tied to peak-era acquisitions. In other words, this is a market recalibrating – not one breaking. Importantly, this environment reinforces alignment between investors and borrowers. In most cases, these are not distressed homeowners exiting at a loss – they are investors working through projects under pressure. Outcomes are driven by execution: completing renovations, pricing appropriately, and bringing needed housing stock back to market. In that sense, successful investments and positive borrower outcomes are directly linked.
Foreclosure Activity: Rising, But Not a Crisis
Foreclosure Filing Trends (Year-Over-Year)
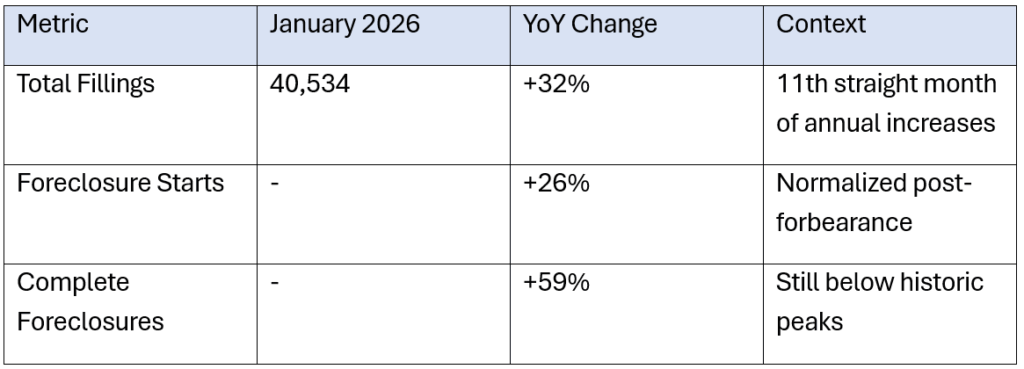
Source: ATTOM U.S. Foreclosure Market Report, January 2026
The 2008 crisis was a credit event. What’s happening today is structurally different. According to the Anchor Loans U.S. Housing Monitor (March 2026), median U.S. mortgage principal and interest payments have doubled since 2021, but that pressure reflects a rate and affordability squeeze, not a collapse in underlying asset values or lending standards. The homeowners entering distress in 2026 are largely being squeezed by carrying costs they can no longer sustain, not underwater on overleveraged purchases with no equity. That distinction fundamentally changes what the opportunity looks like for investors.
As Shane Lex, Managing Director of Loan Originations at Anchor Loans, explains: “This isn’t widespread distress; it’s pressure on deals underwritten in a very different market. Investors who bought in 2023–2024 are now facing longer hold times, higher construction costs, and elevated carrying costs. That combination is what’s driving much of the delinquency and foreclosure activity we’re seeing in the investor segment.”
Aging Housing Stock Is Driving Value-Add Opportunity
One defining characteristic of this foreclosure wave makes it especially relevant to fix-and-flip investors: the properties entering distress are older. The Anchor Loans U.S. Housing Monitor (March 2026) shows that the median age of U.S. housing stock has been climbing steadily since 1994 and continues to rise, a direct result of single-family housing starts remaining far below historically normal levels for well over a decade. The Monitor confirms that U.S. housing is undersupplied relative to core demand, and that an aging housing stock is creating strong structural need for rehabilitation and modernization. Notably, the NAHB Remodeling Sentiment Index tracked in the Monitor has remained above 50, indicating that market conditions for remodeling continue to be favorable.
For fix-and-flip investors, older distressed properties create both opportunity and complexity. The opportunity is a growing pipeline of properties available at real discounts in markets with genuine end-buyer demand. The complexity is that older homes frequently require more comprehensive renovation scopes. Deferred maintenance, outdated systems, and code compliance requirements add cost and timeline variables that need to be carefully modeled before acquisition.
Market Selection Has Never Mattered More
The geographic divergence in this market is significant. While national home price growth has softened, performance varies sharply by region.
The strongest growth is concentrated in the Midwest and Northeast, while markets like Texas, Florida, and parts of the Southeast are seeing weaker performance. At the MSA level, the spread is even more pronounced – New York at +5.8% annualized appreciation versus Austin at -4.7%.
Inventory tells the same story. Supply remains 50–80% below historical averages in many Northeast and Midwest markets, while others are running above normal levels.
Tight supply supports exit values. Elevated supply compresses them.
For investors, this is no longer a national market – it’s a local one. Success depends on aligning projects with what buyers in specific submarkets actually want and can afford.
Housing Market Performance by Region (3-Month Annualized HPA)
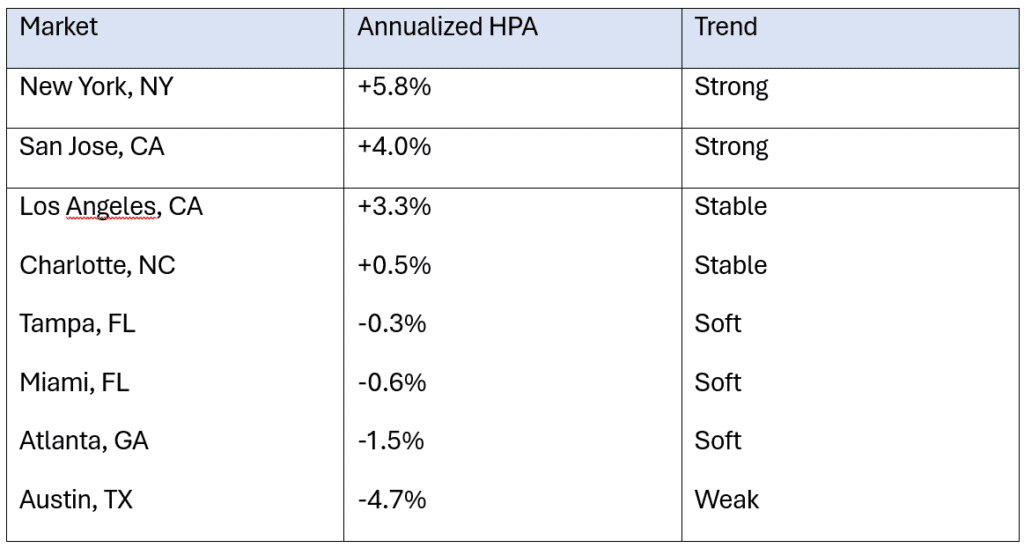
(Source: Anchor Loans U.S. Housing Monitor, March 2026 / Zillow, data as of February 28, 2026)
Updating Your Underwriting for 2026
The traditional 70% rule (acquiring at no more than 70% of after-repair value minus estimated renovation costs) has been a standard fix-and-flip guideline for years. In 2026, particularly when working with older distressed properties, many experienced operators are now modeling with a tighter 65-68% ARV multiplier and building in a renovation contingency buffer of approximately 15%. Older homes more frequently reveal additional issues once work begins, and carrying costs in slower-moving markets can erode margins quickly.
The Anchor Loans Housing Monitor confirms that affordability remains challenging nationally on high prices and elevated mortgage rates, and that housing affordability indices remain near historic lows. That context matters for underwriting exit assumptions, buyers in many markets are stretched, which affects the price ceiling on a renovated product and the time it takes to sell.
Speed of Capital Is a Deal Variable
A consistent theme among experienced operators in the current market is that closing speed is functioning as a genuine competitive differentiator. Foreclosure auctions operate on fixed timelines. The best-priced distressed properties in high-demand markets, particularly in the Northeast and Midwest where inventory is running 60-80% below historical averages according to the Anchor Loans Housing Monitor, do not wait for 45-to-60-day bank approval cycles. Investors with pre-arranged financing, clear underwriting, and a capital partner who can move quickly are consistently outpacing those who can’t.
We don’t believe there’s a single national playbook for fix-and-flip success in 2026. Real estate is local, and lending should be too. The data clearly shows that the markets rewarding investors right now are those with tight supply, employment-driven demand, and a buyer pool that is less stretched on affordability, and those are exactly the conditions Anchor’s team evaluates when helping investors structure deals. The foreclosure pipeline is expanding deal flow. The aging housing stock is creating value-add opportunity. The data tells you where to look. The question is whether you are positioned to move when the right deal appears.
This environment also rewards brokers who stay ahead of investor needs. As more builders and renovators look for reliable financing partners, those who understand project viability – and align borrowers with capital that can execute – will continue to gain share. In a market where timing, certainty, and execution matter more than ever, the right lending partner becomes a true portfolio multiplier.


0 Comments