This frequently overlooked indicator signals unexpected price, demand adjustments.
Bidding behavior at distressed property auctions acts as a reliable barometer of future retail housing market trends, and that bidding behavior in late 2024 points to a possible rebound in the spring and summer 2025 housing market.
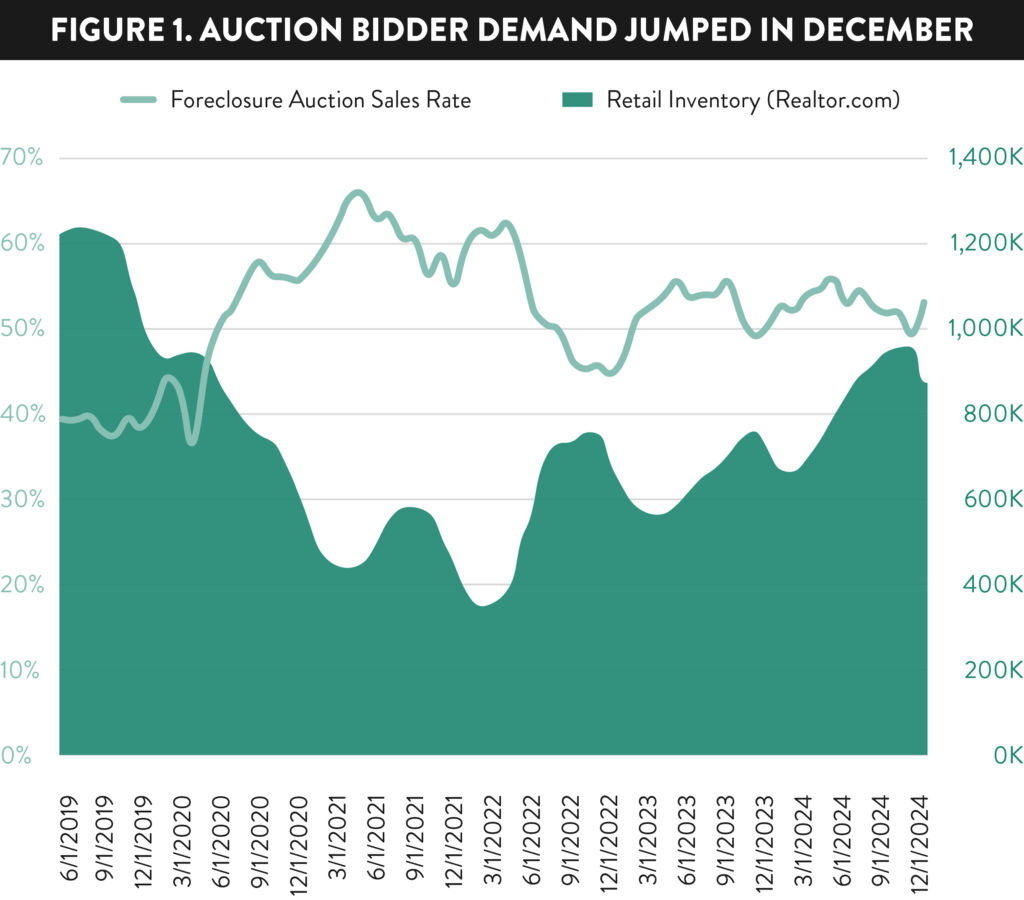
As measured by sales rate—the share of properties available for auction that sell to third-party buyers—demand from the local community developers buying at foreclosure auction jumped in the final month of 2024, stopping a downward trend that started in June.
That sales rate was down or flat in five of the six months between June and November before spiking 7% in December to a five-month high. The December sales rate was also up 5% from a year ago (see Fig. 1).
Auction PriceS Reflect Rising Confidence
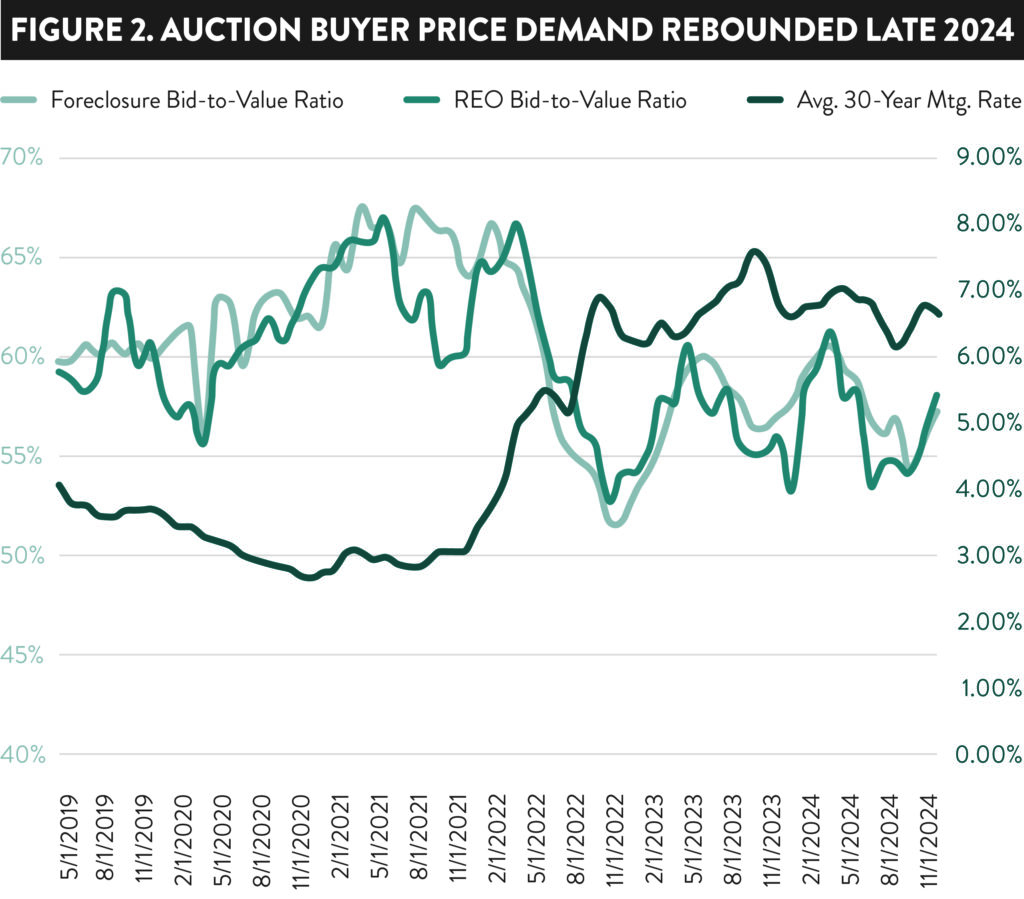
Similarly, the price that winning bidders at auction were willing to pay relative to estimated after-repair value increased at the end of the year, up 3% in November and up another 3% in December. Those two monthly increases followed five out of six months with a declining bid-to-value ratio. The bid-to-value ratio in December was at a six-month high (see Fig. 2).
The bid-to-value ratio for properties purchased at bank-owned (REO) auctions also hit a six-month high in December, rising monthly in November and December following five out of six months with declines.
“The shortage of foreclosures going to auction is making us more likely to buy properties with tighter margins,” wrote one Auction.com buyer in response to a buyer sentiment survey sent in early January.
Election Results Bolster Investor Confidence
The survey found that the November election boosted the confidence of many local community developers buying at auction. More than one in four surveyed (43%) said the results of the election increased their willingness to buy distressed properties at auction compared to only 3% who said the results of the election decreased their willingness to buy. The remaining 54% said the election results had no impact on their willingness to buy.
“Election results should create a better market going forward,” wrote one survey respondent. Despite the market optimism surrounding the election outcome, most buyers still consider market conditions a headwind to their investing rather than a tail wind. More than one-third of buyers surveyed (35%) said the market environment is making them less willing to buy distressed properties at auction compared to 24% who said market conditions are making them more willing to buy.
“You know, it is a day-by-day market pulse,” wrote one buyer in the survey. “I feel better about the coming (months) but other world issues could change things.”
Auction Trends As Market Predictors
If the optimism among auction buyers—both in word and deed—that emerged in late 2024 continues into early 2025, it would bode well for the 2025 spring and summer housing markets. That’s because the local community developers who represent the majority of buyers at auction often know their local markets as well as anyone and are proficient at anticipating future market trends. Their continued success as real estate investors hinges on them accurately anticipating what the market will look like about three to six months in advance—the typical time it takes to renovate a distressed property purchased at auction and return it to the retail market as a rental or resale.
“I look mostly at the local market, without paying attention to the entire market,” wrote one survey respondent. “I’m a little less aggressive than I was several years ago, but that is determined by my local market.”
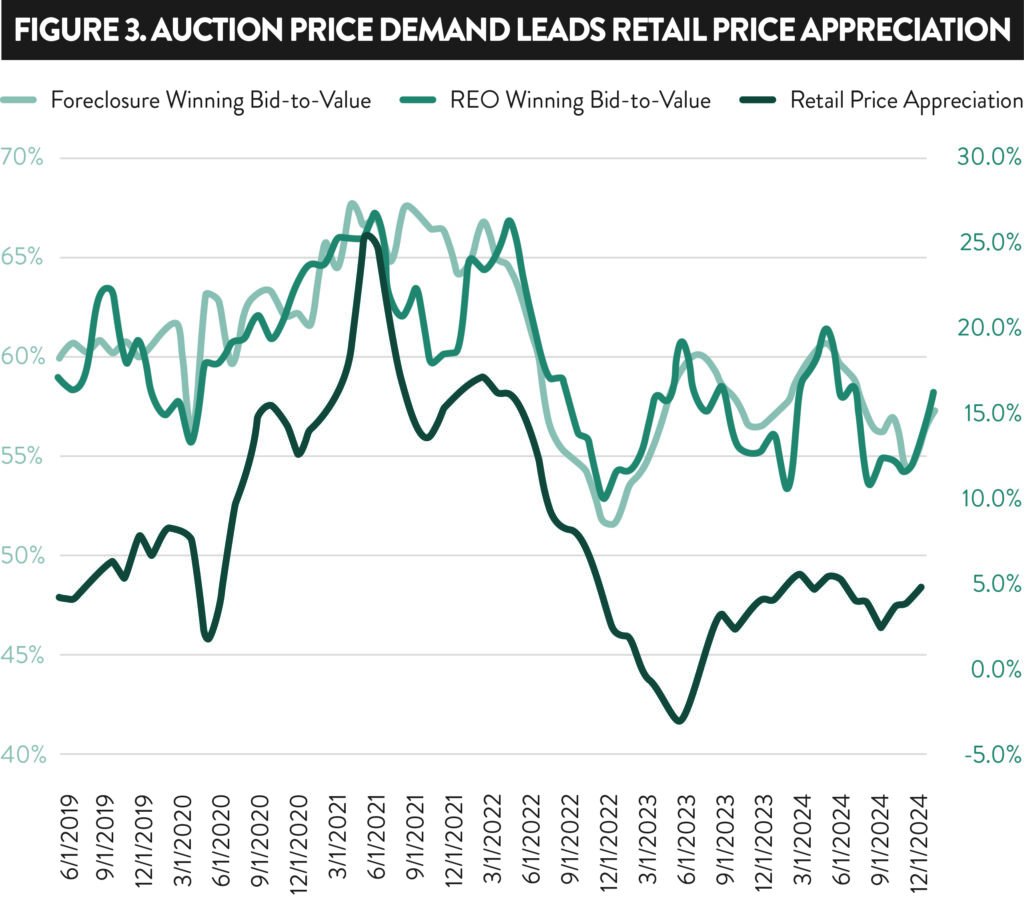
A sharp drop in auction sales rates (quantity demanded) and average bid-to-value ratios (price demanded) in late 2022 preceded a correction in retail home prices in mid-2023. Those same demand metrics started rising again in early 2023, even as retail home prices were continuing to slide, and preceded the rebound in the retail market that came later in 2023 and into 2024 (see Fig. 3).
What to Expect in Early 2025
The slide in auction demand metrics in the second half of 2024—excluding the sharp divergence from that trend in December—indicates a sluggish retail housing market in the first quarter of 2025.
“First-time homebuyers have been waiting for interest rates to fall,” wrote one survey respondent. “Rising taxes and insurance are impacting them also.”
This sluggish first quarter may be when many existing home sellers finally start to go through the uncomfortable process of realizing their homes won’t sell for as high a price as they hoped. There is already evidence of this happening, with six consecutive months through December where median listing prices have decreased from a year ago, according to Realtor.com data.
But if the rebound in auction buyer demand seen in December continues—and there is early evidence in the January numbers that it will —that could foreshadow a rebounding retail market in the prime selling seasons of spring and summer.
“Going into the New Year, I do feel that the market will improve and as such if the home can be bought at a reasonable price, I’m a buyer,” wrote one survey respondent.
Regional Trends
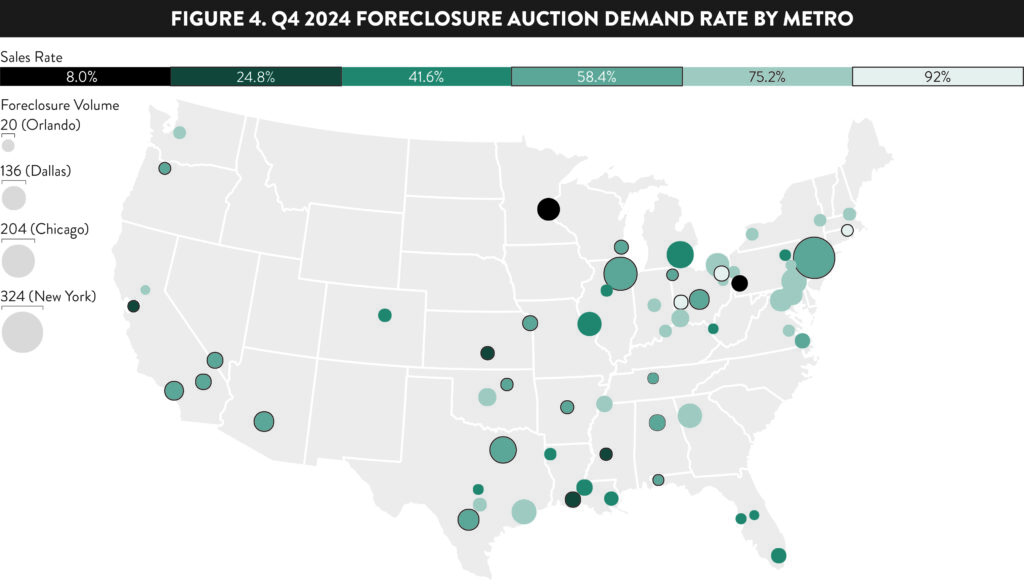
Among the nation’s 50 top markets in terms of completed foreclosure auctions in Q4 2024, those with the biggest annual increase in quantity demand (sales rate) were seen in:
- Flint, Michigan
- Wichita, Kansas
- Akron, Ohio
- Jackson, Mississippi
- St. Louis, Missouri
Other markets in the top 10 for biggest increases in demand were Toledo, Ohio; Indianapolis, Indiana; Birmingham, Alabama; Youngstown, Ohio; and Cleveland, Ohio (see Fig. 4).
Meanwhile, among the same 50 markets, those with the biggest annual decrease in demand were:
- Phoenix, Arizona
- Lafayette, Louisiana
- Miami, Florida
- Los Angeles, California
- Pittsburgh, Pennsylvania
Other markets in the top 10 for biggest decrease in demand were Dallas-Fort Worth, Texas; San Antonio, Texas; Denver, Colorado; Las Vegas, Nevada; and Minneapolis-St. Paul.
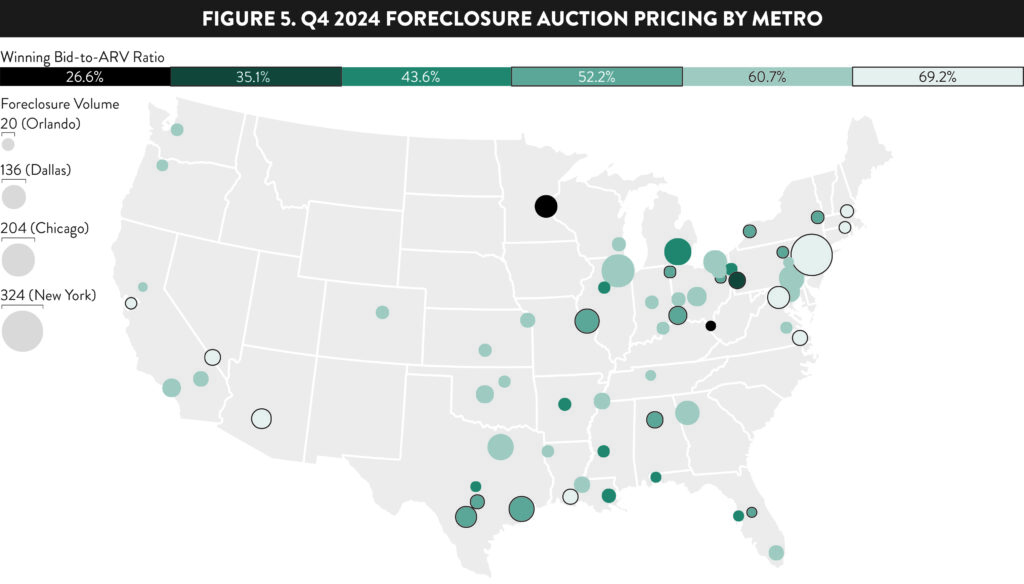
Auction Pricing Trends by Metro
Among the nation’s top 50 markets in terms of completed foreclosure auctions in Q4 2024, those with the biggest annual increase in price demand (big-to-value ratio) were:
- Wichita, Kansas
- Canton, Ohio
- Kansas City, Missouri
- Denver, Colorado
- Akron, Ohio
Other markets in the top 10 were New Orleans, Louisiana; Lafayette, Louisiana; Cleveland, Ohio; Providence, Rhode Island; and Seattle, Washington (see Fig 5).
Among the same 50 markets, those with the biggest annual decrease in price demand were:
- Pittsburgh, Pennsylvania
- Jackson, Mississippi
- Youngstown, Ohio
- Flint, Michigan
- Little Rock, Arkansas
Other markets in the top 10 were Minneapolis-St. Paul; Los Angeles, California; Houston, Texas; Detroit, Michigan; and Cincinnati, Ohio.









0 Comments