

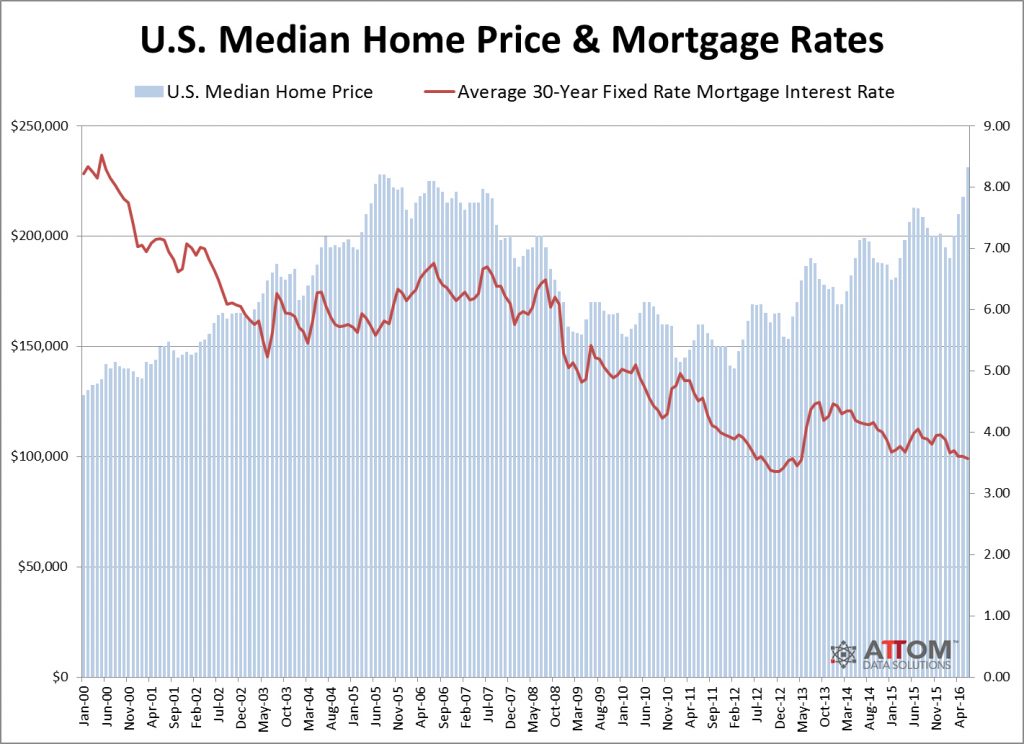
Single-family homes and condos sold for a median price of $231,000 in June 2016, up 6 percent from the previous month and up 9 percent from a year ago to a new all-time high — 1 percent above the previous peak of $228,000 in July 2005, according to ATTOM Data Solutions’ June and Q2 2016 U.S. Home Sales Report. ATTOM Data Solutions is the new parent company of RealtyTrac, the nation’s leading source for comprehensive housing data.
June was the 52nd consecutive month were U.S. median home prices increased on a year-over-year basis.
The ATTOM Data Solutions home sales report is based on publicly recorded sales deeds collected and licensed by ATTOM Data Solutions in more than 900 counties nationwide, accounting for more than 80 percent of the U.S. population.
Local metro markets
Out of 130 metropolitan statistical areas analyzed for the report, 39 (30 percent) reached new all-time home price peaks in June, including Dallas ($240,156), Atlanta ($192,000), Seattle ($385,000), Minneapolis ($235,950) and St. Louis ($190,209).
“Home prices in the greater Seattle area continue to appreciate above average rates. This is clearly an indication of not only continued faith in the housing market, but also the buoyancy of the regional economy,” said Matthew Gardner, chief economist at Windermere Real Estate, covering the Seattle market. “However, this appreciation comes at a cost. Housing affordability in the region is getting tested — specifically in the market areas that are within easy reach of the major employment centers. This is having particularly negative effects on first-time buyers who are getting priced out of the market. Unless we see a rapid increase in the number of homes for sale, this significant demographic will continue to be left behind.”
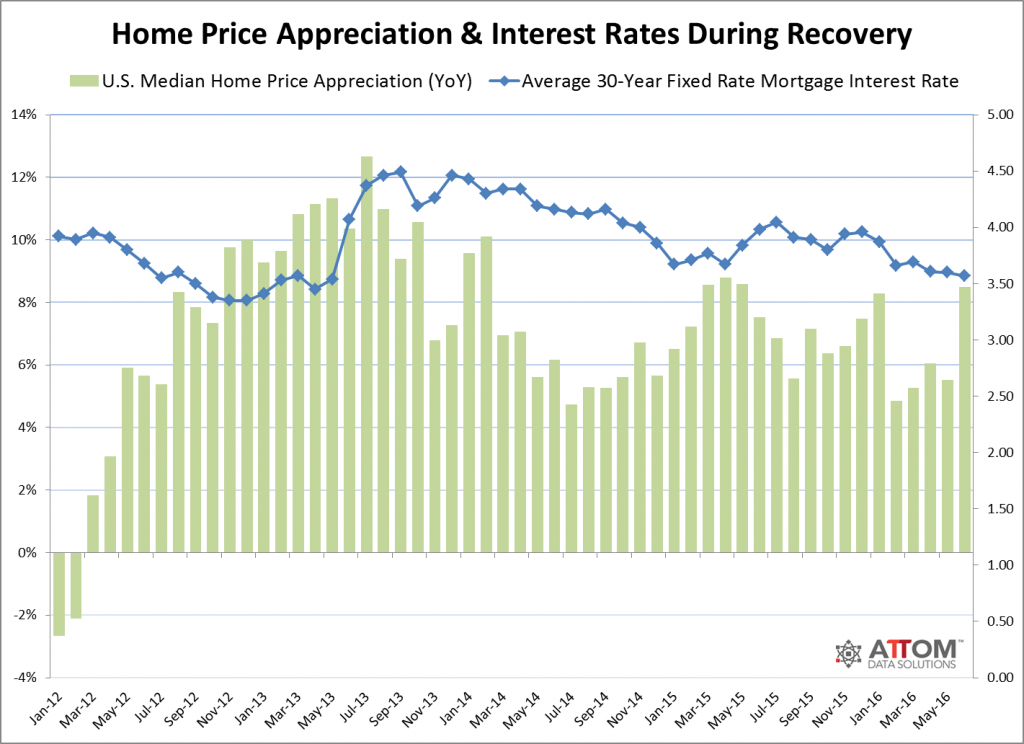
Since the nation’s home prices bottomed out in 2012, a total of 63 of the 130 markets analyzed (48 percent) have reached new all-time home price peaks.
“The all-time home price highs nationwide an in many local markets are being enabled by historically low mortgage rates — which are falling once again this year,” said Daren Blomquist, senior vice president at ATTOM Data Solutions (formerly RealtyTrac). “It is likely that some of the most interest-rate-sensitive local markets will see home price appreciation knocked down when the low rate rug is finally pulled out from under the housing recovery. We are seeing signs of weakening appreciation in many bellwether markets already in spite of the rock-bottom rates.”
Click here to view an interactive map showing home price peaks by metro area.
Markets with strongest appreciation
Metro areas with the biggest year-over-year increase in median home price in June were Salisbury, Maryland (up 22 percent); Pensacola, Florida (up 21 percent); Tampa, Florida (up 20 percent); St. Louis (up 19 percent); Boulder, Colorado (up 19 percent); and Flint, Michigan (up 18 percent).
Along with Tampa and St. Louis, major metro areas with a population of at least 1 million where median home sales prices increased at least 10 percent from a year ago in June 2016 included Orlando (up 13 percent); Phoenix (up 12 percent); Austin, Texas (up 12 percent); Portland, Oregon (up 12 percent); Denver (up 11 percent); and Virginia Beach-Norfolk-Newport News, Virginia (up 10 percent).
There were 16 metro areas among the 130 analyzed (12 percent) where median home prices declined from a year ago in June, including Bridgeport, Connecticut (down 6 percent); Allentown, Pennsylvania (down 4 percent); Columbus, Ohio (down 3 percent); Houston (down 2 percent); and Milwaukee (down 1 percent).
Highest average price gain
Home sellers in June 2016 sold for an average of $41,000 more than they purchased for, a 22 percent gain in price on average — the highest average price gain for home sellers since September 2007.
Metro areas with the highest average price gains for home sellers in June were San Francisco (72 percent); San Jose (66 percent); Fort Collins, Colorado (59 percent); Salinas, California (53 percent); and Santa Rosa, California (52 percent).
Other major markets with a population of at least 1 million where the average price gain for home sellers in June was at least 40 percent included Denver (50 percent), Los Angeles (49 percent), Portland (49 percent), Seattle (48 percent) and San Diego (40 percent)
Home price appreciation
Annual home price appreciation in June 2016 slowed compared to a year ago in 189 counties out of 349 counties (54 percent) analyzed for the report.
Counties with decelerating appreciation in June 2016 compared to a year ago included Los Angeles County, California; Harris County (Houston), Texas; Maricopa County (Phoenix), Arizona; San Diego County, California; Orange County, California; Miami-Dade County, Florida; Dallas County, Texas; and Queens County, New York.
Counties with accelerating appreciation in June 2016 compared to a year ago included Kings County (Brooklyn), New York; Riverside County, California; King County (Seattle), Washington; Sacramento County, California; Hillsborough County (Tampa), Florida; Hennepin County (Minneapolis), Minnesota; and Travis County (Austin), Texas.
Distressed sales
Distressed sales, including bank-owned sales, in-foreclosure sales and short sales, accounted for 14.8 percent of all single-family home and condo sales in Q2 2016, down from 18.6 percent of all sales in the first quarter and down from 16.7 percent of all sales in Q2 2015 to the lowest level since Q3 2007.
States with the highest share of distressed sales in the second quarter were Maryland (24.9 percent), New Jersey (23.8 percent), Illinois (23.6 percent), Connecticut (19.5 percent) and Michigan (19.3 percent).
Among metropolitan statistical areas with at least 1,000 sales of single-family homes and condos in Q2 2016, those with the highest share of distressed sales were Rockford, Illinois (28.9 percent); Flint, Michigan (25.2 percent); Baltimore (24.3 percent); Chicago (23.8 percent); and New Haven, Connecticut (23.8 percent).
Click here for a chart showing U.S. distressed home sales.
Cash sales
Cash buyers accounted for 27.5 percent of all single-family home and condo sales in Q2 2016, down from 32.3 percent in the previous quarter and down from 30.4 percent in Q2 2015 to the lowest level since Q4 2007.
States with the highest share of cash buyers in Q2 2016 were Hawaii (44.8 percent), Florida (44.4 percent), New Jersey (40.7 percent), New York (39.3 percent) and Michigan (37.1 percent).
Among 145 metro areas with at least 1,000 total sales in Q2 2016, those with the highest share of cash buyers were Sebastian-Vero Beach, Florida (56.0 percent); Naples, Florida (55.9 percent); Sarasota, Florida (49.1 percent); Miami (49.1 percent); and Punta Gorda, Florida (48.7 percent).
Other major metros with a population of at least 1 million where cash buyers accounted for more than one-third of all sales included Tampa (42.2 percent); New York (40.6 percent); Raleigh, North Carolina (39.1 percent); Philadelphia (38.7 percent); and Detroit (38.3 percent).
Click here for a chart showing cash buyer share of home sales.
Institutional investors
Institutional investors (entities purchasing at least 10 properties in a calendar year) accounted for 2.6 percent of all single-family and condo sales in Q2 2016, down from 2.8 percent in the first quarter but up from 1.8 percent in Q2 2015.
States with the highest share of institutional investors in Q2 2016 were Alabama (6.7 percent), Georgia (5.9 percent), Arkansas (4.1 percent), Louisiana (4.0 percent) and New Mexico (4.0 percent).
Among 145 metro areas with at least 1,000 total sales in Q2 2016, those with the highest share of institutional investors were Birmingham, Alabama (8.9 percent); Memphis (8.0 percent); Killeen, Texas (6.7 percent); Augusta, Georgia (6.5 percent); and Lakeland, Florida (6.3 percent).
FHA buyers’ share
FHA buyers accounted for 16.1 percent of all single-family home and condo sales in Q2 2016, up from 15.1 percent in the previous quarter but down from 16.4 percent a year ago.
States with the highest share of FHA buyers in Q2 2016 were Indiana (30.5 percent), Utah (29.1 percent), Idaho (25.1 percent), New Mexico (24.1 percent) and Missouri (22.3 percent).
Among 145 metro areas with at least 1,000 total sales in Q2 2016, those with the highest share of FHA buyer were Ogden, Utah (37.0 percent); Visalia-Porterville, California (32.1 percent); Bakersfield, California (31.6 percent); Salt Lake City, Utah (29.7 percent); and Indianapolis (29.4 percent).
Report methodology
The RealtyTrac U.S. Home Sales Report provides percentages of distressed sales and all sales that are sold to investors, institutional investors and cash buyers, a state and metropolitan statistical area. Data is also available at the county and ZIP code level upon request. The data is derived from recorded sales deeds, foreclosure filings and loan data. Statistics for previous quarters are revised when each new report is issued as more deed data becomes available for those previous months. Median sales price is calculated based on the sales price on the publicly recorded sales deed when available. If no sales price is recorded then the purchase loan amount is used to calculate median price, and if no purchase loan amount is available, the property’s Automated Valuation Model (AVM) at time of sale is used to calculate the median price.
About ATTOM Data Solutions
ATTOM Data Solutions is the curator of the ATTOM Data Warehouse, a multi-sourced national property database that aggregates property tax, deed, mortgage, foreclosure, environmental risk, natural hazard, health hazards, neighborhood characteristics and other property characteristic data for more than 150 million U.S. properties. The ATTOM Data Warehouse delivers actionable data to businesses, consumers, government agencies, universities, policymakers and the media in multiple ways, including bulk file licenses, APIs and customized reports.
ATTOM Data Solutions also powers consumer websites designed to promote real estate transparency: RealtyTrac.com is a property search and research portal for foreclosures and other off-market properties; Homefacts.com is a neighborhood research portal providing hyperlocal risks and amenities information; HomeDisclosure.com produces detailed property pre-diligence reports.


0 Comments