

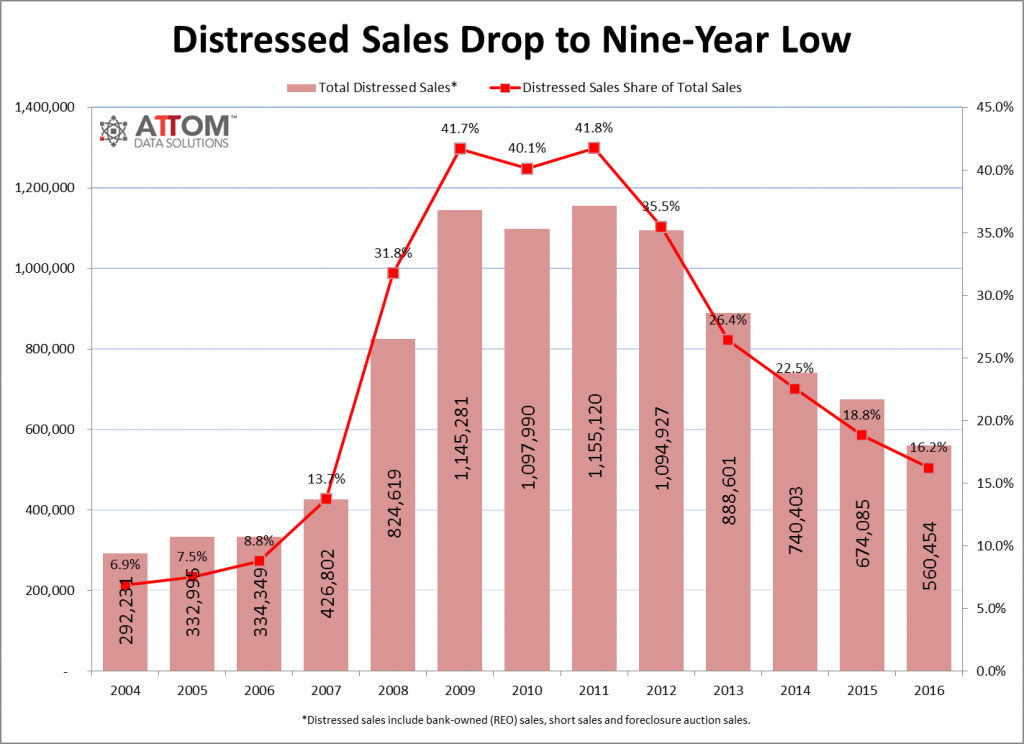
ATTOM Data Solutions’ Year-End 2016 Home Sales report shows 16.2 percent of single-family home and condo sales in 2016 were distressed sales — bank-owned sales, short sales or foreclosure auctions sold to third-party buyers — down from 18.8 percent of all sales in 2015 to the lowest level since 2007, a nine-year low.
Metro Statistics with Populations of 200,000+
Among 193 metropolitan statistical areas with a population of 200,000 or more and at least 100 distressed sales in 2016, those with the highest share of total distressed sales were Atlantic City, New Jersey (43.8 percent); Hagerstown-Martinsburg, Maryland-West Virginia (33.2 percent); Rockford, Illinois (29.2 percent); Montgomery, Alabama (29.2 percent); and Baltimore, Maryland (28.0 percent).
Bank-owned (REO) sales accounted for 8 percent of all sales in 2016, down from 10 percent in 2015 to the lowest level since 2006 — a 10-year low.
Short sales — homes that sold for less than the combined amount of loans secured by the property — accounted for 5.5 percent of all home sales in 2016, down from 6 percent in 2015 to the lowest level since 2008, an eight-year low.
Foreclosure auction sales (trustee’s sales or sheriff’s sales) selling to third-party investors (not including those going back to the foreclosing lender) accounted for 2.8 percent of all home sales in 2016, down from 2.9 percent in 2015 to the lowest level since 2007 — a nine-year low.
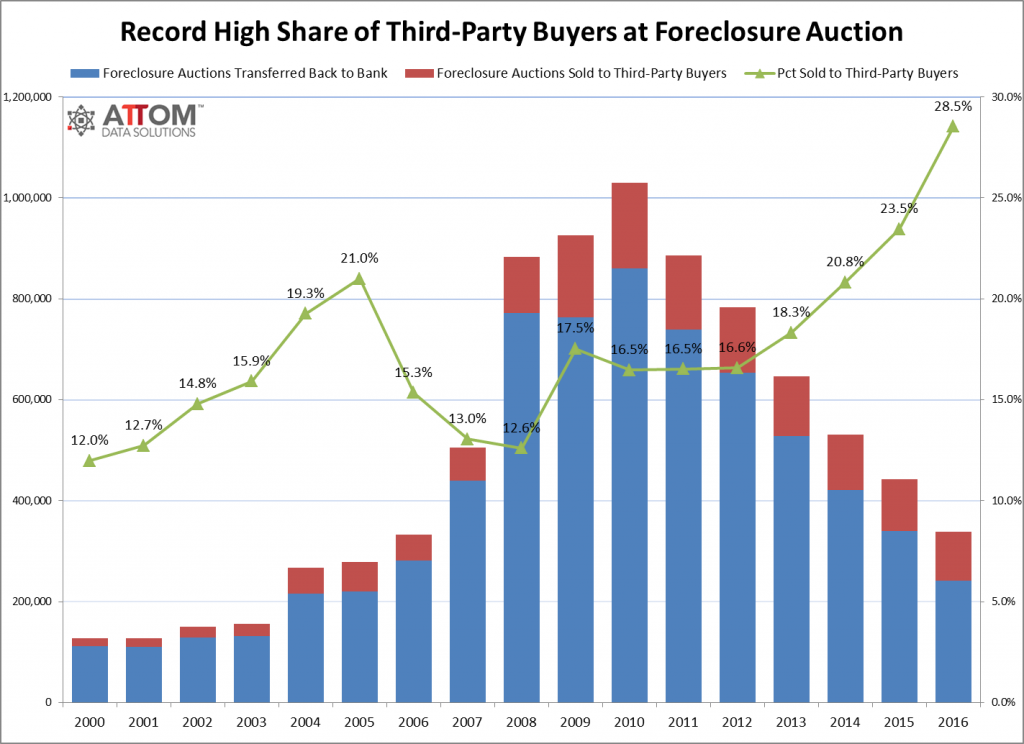
“The housing market hit several important milestones in 2016, with distressed sales at a nine-year low and home prices at a 10-year high, just barely below the pre-recession peak in 2006,” said Daren Blomquist, senior vice president at ATTOM Data Solutions. “This was all good news for home sellers, who realized their biggest average profits since purchase nationwide in 2016. Even distressed property sellers are benefitting from this hot seller’s market, with a record-high share of homes at foreclosure auction being purchased by third-party buyers rather than reverting back to the foreclosing bank.”
Foreclosure Auctions Sold to Third-Party Buyers
Third-party buyers at the foreclosure auction accounted for 28.5 percent of all completed auctions in 2016 (with the remaining 71.5 percent going back to the foreclosing lender), up from 23.5 percent in 2015 to the highest level going back to 2000 — the earliest data is available. A total of 96,438 single-family homes and condos were sold to third-party buyers at foreclosure auctions in 2016.
Among 135 metropolitan statistical areas with at least 200,000 people and at least 100 foreclosure auction sales to third-party investors in 2016, those with the highest share going to third-party buyers were San Jose, California (59.1 percent); Los Angeles (52.2 percent); Reno, Nevada (52.1 percent); Oxnard-Thousand-Oaks-Ventura, California (50.3 percent); and Stockton, California (50.2 percent).
Metro areas with the highest total number of foreclosure auction sales to third-party investors in 2016 were Miami (4,954), Philadelphia (4,043), Atlanta (3,657), New York-Newark-Jersey City (3,495) and Tampa (3,163).
“The increased competition at the foreclosure auction is resulting in higher sales prices there, which can even result in surplus proceeds going to the distressed homeowner in some cases after other lien holders have been paid,” Blomquist added. “Our analysis of sales prices at completed foreclosure auctions in 2016 shows the smallest average loss from the property’s previous sale price since 2007, with 29 percent of properties nationwide selling for more than the previous sales price at the foreclosure auction. In a handful of markets such as Seattle, Los Angeles, Portland, San Francisco and San Diego, more than 50 percent of properties sold at foreclosure auctions in 2016 sold for more than their previous sale price.”
Biggest Average Profits for Sellers Since 2007
Homeowners who sold in 2016 realized an average home price gain since purchase of $38,206, which translated into an average 21 percent gain since purchase, up from an average 13 percent gain in 2015 to the highest since 2007, a nine-year high.
Among 201 metropolitan statistical areas with a population of at least 200,000 and sufficient home price data, those with the highest average percent gain since purchase for home sellers in 2016 were San Francisco, California (69 percent); San Jose, California (69 percent); Santa Rosa, California (52 percent); Los Angeles, California (49 percent); and Seattle, Washington (48 percent).
“The greater Seattle area saw the fifth-highest average home price percent gain since purchase in 2016 in the country — a quite remarkable data point — and one which demonstrates the strength of the area’s economy,” said Matthew Gardner, chief economist at Windermere Real Estate, covering the Seattle market. “However, despite this rampant price growth, very few homeowners are cashing in on these gains, as listing inventory remains at levels not seen since the late 1990s. Those who are taking advantage of the market are primarily banking their gains and buying another home locally rather than moving to less expensive areas. As long as the Seattle economy continues to outperform the nation, the region will continue to remain high on the list of bullish markets.”
Double-Digit Home Price Increases
Nationwide the median home sales price in 2016 was $218,175, up 6.8 percent from 2015, but still slightly below (0.4 percent) the pre-recession peak of $219,000 in 2006. The 2016 median home price nationwide was up 45 percent from the post-recession low of $150,511 in 2011.
Among 201 metropolitan statistical areas with a population of at least 200,000 and sufficient home price data, 179 (89 percent) posted a year-over-year increase in home prices in 2016, and 27 metro areas (13 percent) posted double-digit year-over-year percentage gains, including Tampa-St. Petersburg, Florida (up 14.0 percent); Denver, Colorado (up 11.3 percent); Portland, Oregon (up 12.1 percent); Orlando, Florida (up 10.1 percent); and Jacksonville, Florida (up 12.9 percent).
Among 299 counties with a population of at least 200,000 and sufficient sales data, those with the highest median home prices in 2016 were New York County (Manhattan), New York ($1,400,000); San Francisco County, California ($1,175,000); San Mateo County, California ($1,075,000); Marin County, California ($950,000); and Santa Clara County, California ($860,000).
Forty-Four Percent of Markets Reach All-Time Price Peak
Among 201 metropolitan statistical areas with a population of at least 200,000 and sufficient home price data, 89 metro areas (44 percent) reached new all-time home price peaks in 2016, including Dallas-Fort Worth, Texas ($230,571); Houston, Texas ($214,795); Atlanta, Georgia ($181,000); Boston, Massachusetts ($390,000); and San Francisco, ($720,000).
Meanwhile, 106 of the 201 metro areas analyzed in the report (53 percent) have reached new all-time home price peaks since 2010, after the end of the Great Recession.
Ninety-five of the 201 metro areas analyzed for the report (47 percent), were still below their pre-recession (2009 or earlier) peaks in median home prices in 2016, including the greater New York-Newark-Jersey City (14.3 percent below), Los Angeles (1.8 percent below), Chicago (12.0 percent below), Philadelphia (2.9 percent below); and Washington, D.C. (3.2 percent below).
Top Institutional Investor Markets
Nationwide home sales to institutional investors (entities purchasing at least 10 single-family homes or condos in a calendar year) represented 2.8 percent of all home sales in 2016, up slightly from 2.7 percent in 2015, but down from a peak of 7.8 percent in 2012.
Among 196 metropolitan statistical areas with at least 200,000 people and sufficient data, those with the highest share of institutional investor purchases in 2016 were Columbus, Georgia-Alabama (11.6 percent); Birmingham, Alabama (10.0 percent); Memphis, Tennessee (9.9 percent); Montgomery, Alabama (9.6 percent); and Binghamton, New York (9.1 percent).
Cash Home Purchases Drops to Nine-Year Low
Nationwide home sales to all-cash buyers represented 28.3 percent of all home sales in 2016, down from 31.5 percent in 2015 to the lowest level since 2007 — a nine-year low.
Among 196 metropolitan statistical areas with at least 200,000 people and sufficient data, those with the highest share of all-cash sales were Binghamton, New York (69.4 percent); Buffalo, New York (63.6 percent); Syracuse, New York (58.4 percent); Macon, Georgia (52.5 percent); and Montgomery, Alabama (52.5 percent).
Top FHA buyer markets in Texas, Utah, Central California
Nationwide home sales to buyers using FHA loans (typically first time home buyers or others with a low-down payment) represented 15.5 percent of all home sales in 2016, up slightly from 15.4 percent in 2015, but below the peak of 23.8 percent in 2009.
Among 196 metropolitan statistical areas with at least 200,000 people and sufficient data, those with the highest share of FHA-buyer purchases were McAllen, Texas (35.0 percent); Ogden, Utah (34.2 percent); Merced, California (32.6 percent); Visalia-Porterville, California (31.9 percent); and Salt Lake City, Utah (29.6 percent).

To read full report click here.
About ATTOM Data Solutions
ATTOM Data Solutions, the parent company of RealtyTrac, is the curator of the ATTOM Data Warehouse, a multi-sourced national property database that blends property tax, deed, mortgage, foreclosure, environmental risk, natural hazard, health hazards, neighborhood characteristics and other property characteristic data for more than 150 million U.S. residential and commercial properties. The ATTOM Data Warehouse delivers actionable data to businesses, consumers, government agencies, universities, policymakers and the media in multiple ways, including bulk file licenses, APIs and customized reports.


0 Comments