
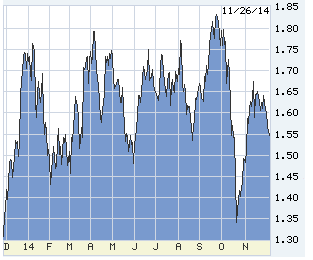
 Long-term interest rates have broken a narrow, month-long range… down. The lowest-fee mortgages are trying to cross below 4.00%, and the 10-year T-note, the driver of the show, now 2.23%.
This is a big move, reinforcing a downtrend. However, this is also a holiday week, markets thin, and November jobs data due next Friday may cancel the whole thing.
But I doubt it. I think the move is real. This is Thanksgiving, so be kind, but the financial press is not doing its job — for whatever reasons in thrall of the sunshine boys. The US economy is okay, sort of, but not accelerating.
New US data has been confused by 3rd Quarter GDP revised up to 3.9% growth, the best ninety days in eleven years. Unfortunately not confirmed by anything else. Home sales — new, old, or pending — are flat. The 85-component Chicago Fed National Activity Index never made it above .32 in Q3 (.70 would amount to something), and in October retreated to .01. Core orders for durable goods were expected to rise .5% in October but fell .9%, business capital orders off more than 1% for two months running. Personal income and spending each gained .2% in October, about half the forecast.
That depressing string is just soggy, not a contraction. By itself, soggy is not enough to extend the 2014 decline in rates. Look elsewhere for cause.
The rest of the world
China cut its policy rate by .25% this week, widely misunderstood as stimulus. It is not: it’s a cut to cushion the inevitable slowdown underway. In Japan, Abenomics is in chaos: economic reform never began, the economy fell out from under the first fiscal-repair tax increase, the second has been cancelled, and nothing is left but the BOJ hosing cash. The ECB may adopt QE as early as Friday, but few now trust Draghi’s jawbone, and too late, anyway.
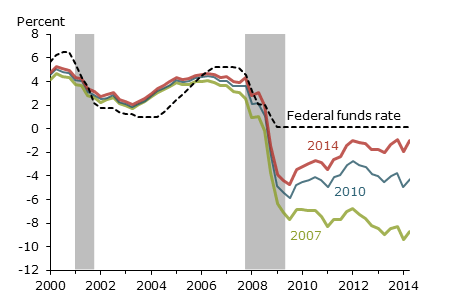
German 10s pay 0.695%, Japan’s 0.437%. Buy USA bonds! 2.23% is fat. The Fed is in a pickle. It’s always in one, one way or another, but this one is new. For the first time since WW II we have reason to doubt the unemployment rate as a signal. The San Francisco Fed this week published an illuminating paper, short and clear. Since the early 1990s the Fed has used a mathematic rule as the primary guide to setting the Fed funds rate. There are many variants now, but the early one is known as the “Taylor Rule” (after John Taylor, a Fed economist then, now a wildly right-wing tub-thumper at Stanford).
Policy rate = 1.25 + (1.5 × Inflation) + or – Output gap.
In English, take a base “real rate” (1.25%), add to it a multiple of inflation (the higher inflation, the harder the Fed has to lean), and add to that the degree the economy is running hotter than capacity. Or subtract the degree running under capacity. In recent years the economy was so far below capacity that the result of the equation was a negative Fed funds rate; at the worst of the Great Recession almost 10% negative. That impossible but necessary command to go below zero led to QE.
We can argue about the 1.25% real rate, but it’s okay. We argue about inflation measurements, too, but the core PCE deflator is fair. GDP can under- or over-measure output in a given quarter (as bloated Q3 this year), but averaging works.
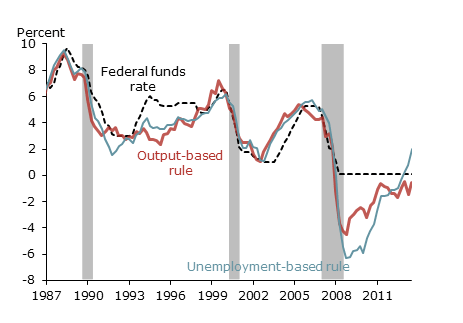
The problem: to quantify the output “gap,” we must determine variance from potential output. These Fed funds equations are cool, but nobody knows how to measure the non-inflationary potential output of the economy — except in the rear-view after an inflation or recession accident. Trying to solve the problem, economist Arthur Okun proposed substituting unemployment for potential. Above 6%, too cold; below, too hot. Maybe. Somewhere in there. Used to be.
Okun’s Law is driving the Fed batty, as it says the Fed should be above zero right now, while the Taylor Rule still produces a below zero solution. Bond traders everywhere are convinced that neither rule applies today, certainly not describing the risk of inflation from running above potential. Unless the economy accelerates the Fed will soon have to concede, too. Buy USA bonds!
———————————————–
10-year T-note, downtrend intact. Next test will be 2.15%, only 0.08% away.

5-year T-note shows total disbelief in Fed tightening. (Shorter-term bonds are more sensitive to the Fed than longer-term ones.)
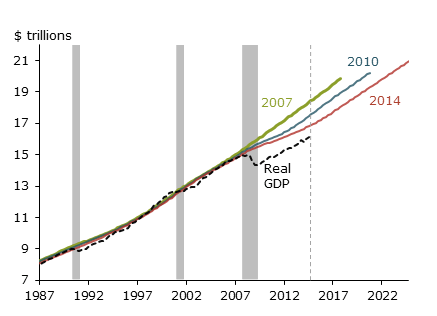
Revisions to GDP “potential,” as estimated by the Bureau of Economic Affairs, the Congressional Budget Office, and the SF Fed. The farther we get from the financial crash in 2007, the more I think the break in actual GDP reflected more than just the bursting credit bubble. And, although we have resumed the prior slope of GDP growth, the continuous downward revision of “potential” makes me think we’re heavily overestimating the risk of overheating and inflation. New world out there.
The Proper setting for the Fed funds rate based on the “Taylor Rule” is still below zero:
Same exercise, Taylor Rule adjusted by Okun’s Law — the unemployment rate substituting for theoretical potential. The blue-gray line drives the Fed nuts, says they should tighten now.
[hs_form id=”4″]


0 Comments