

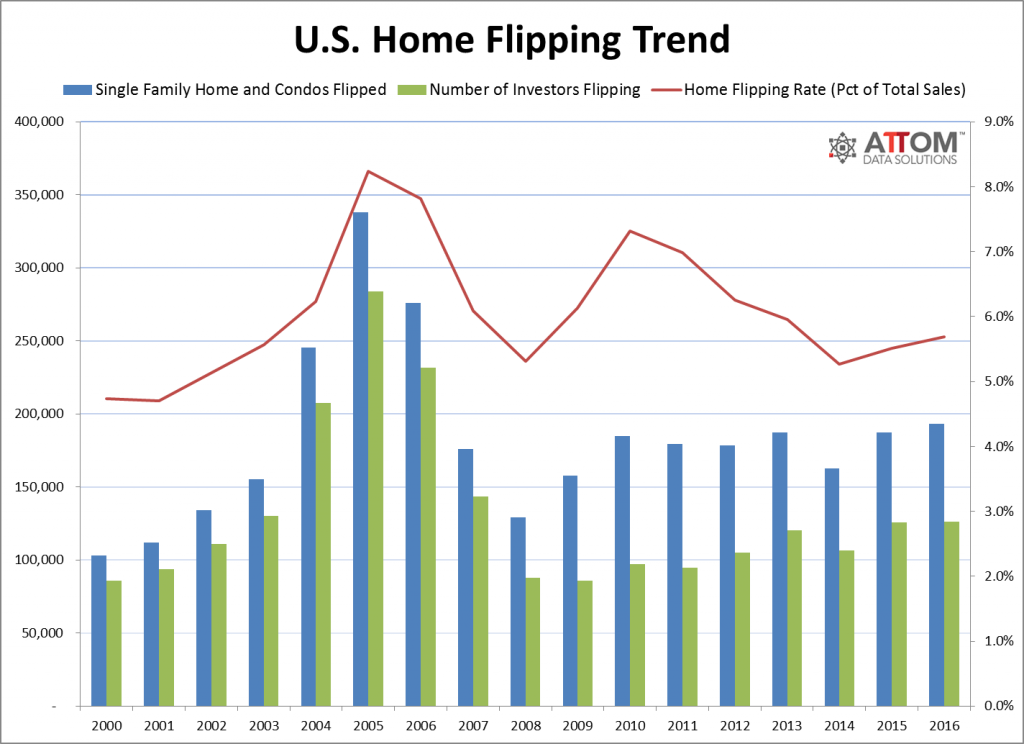
Flips of single-family homes and condos in 2016 were up 3.1 percent from 2015, to the highest level since 2006, according to ATTOM Data Solutions’ 2016 Year-End U.S. Home Flipping Report released March 9, 2017.
The 193,009 single-family homes and condos flips in 2016 accounted for 5.7 percent of all single-family home and condo sales during the year, up from 5.5 percent in 2015 to a three-year high. That was still well below the peak in 2005, however, when 338,207 single-family homes and condos were flipped, representing 8.2 percent of all sales.
For this report, a home flip is defined as a property that is sold in an arms-length sale for the second time within a 12-month period based on publicly recorded sales deed data collected by ATTOM Data Solutions (the parent company of RealtyTrac) in more than 950 counties accounting for more than 80 percent of the U.S. population (see full methodology below).
The report also shows that 126,256 entities — including both individuals and institutions — flipped homes in 2016. That increase was less than 1 percent from 2015 to the highest number since 2007, when 143,266 entities flipped properties.
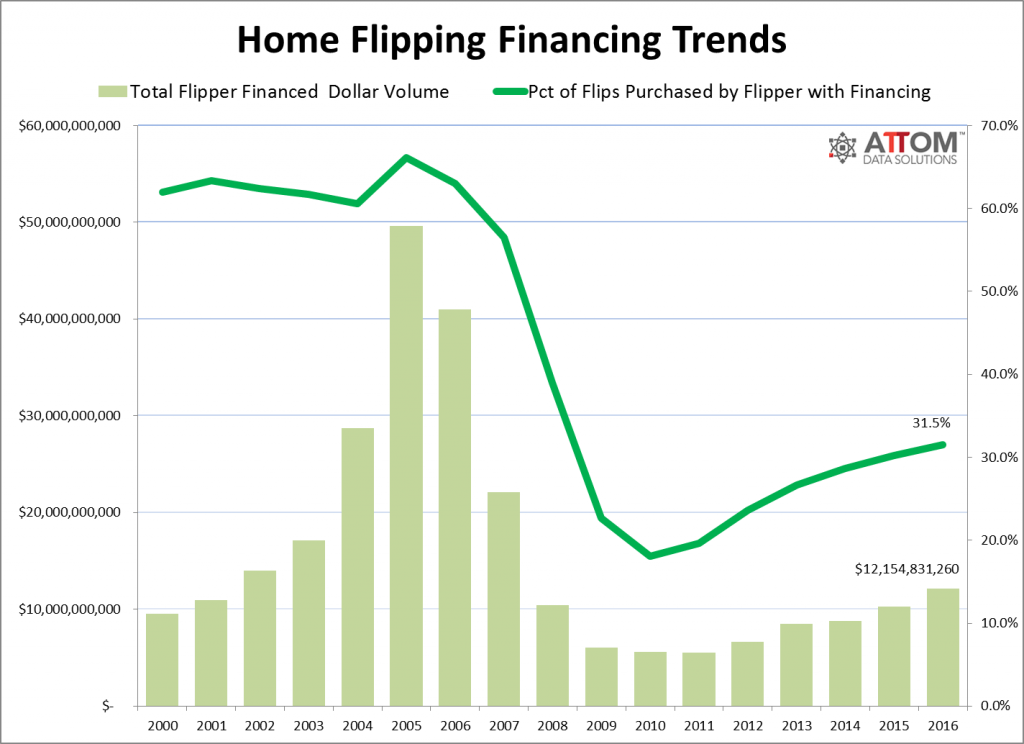
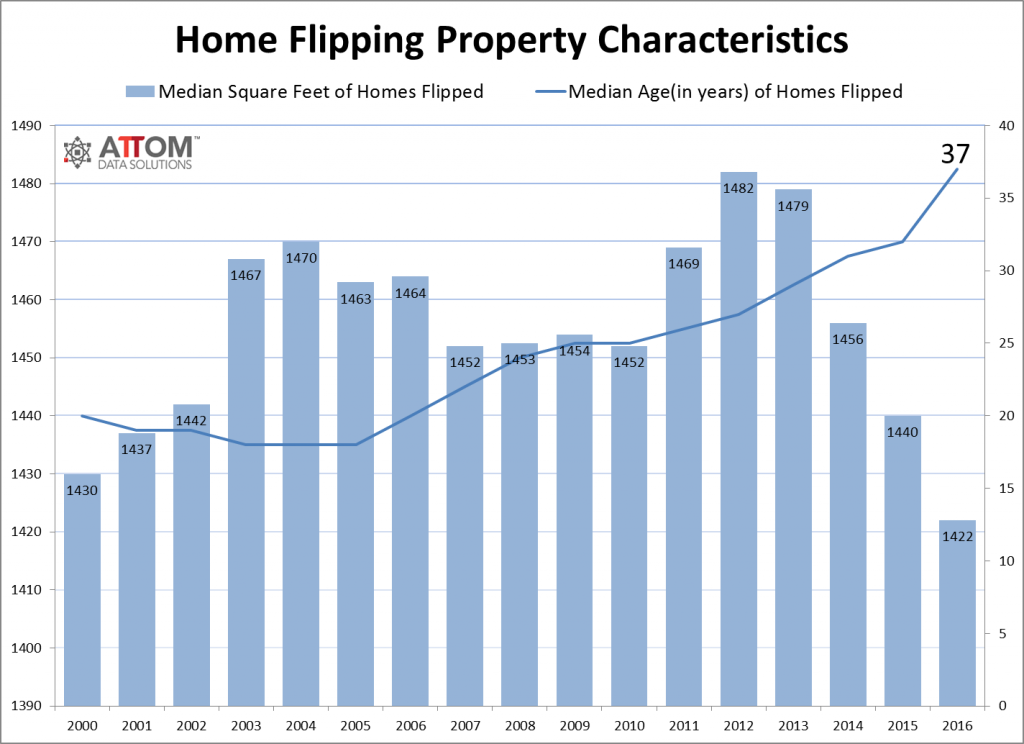
Meanwhile, the share of flipped homes that were purchased by the flipper with financing increased to an eight-year high of 31.5 percent in 2016. While the median age of homes flipped increased to 37 years — a new high going back to 2000, as far back as data is available — and the median square footage of homes flipped decreased to 1422 — a record low going back to 2000.
“Home flipping was hot in 2016, fueled by low inventory of homes in sellable or rentable condition along with a flood of capital — both foreign and domestic — searching for the returns and stability available with U.S. real estate,” said Daren Blomquist, senior vice president at ATTOM Data Solutions. “The combination of more home flips and a greater share of financing for flip purchases resulted in a 19 percent jump in the estimated dollar volume of financing for home flip purchases, up to $12.2 billion for the flips completed in 2016 — a nine-year high.”
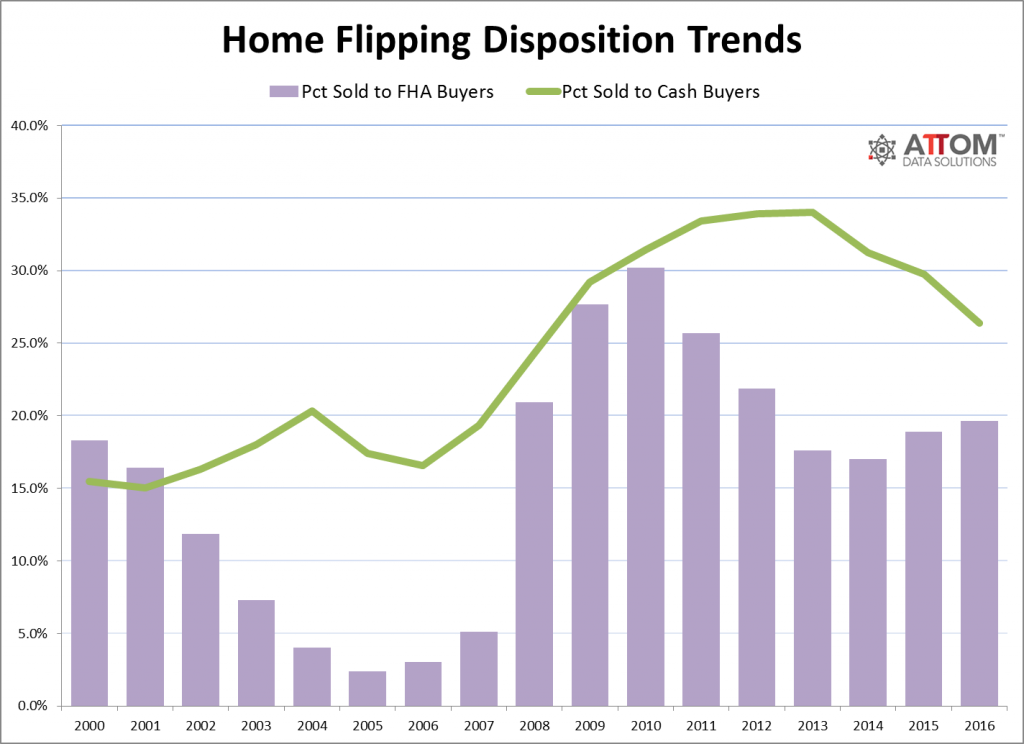
“Investors in search of flipping returns are increasingly willing to move to secondary and tertiary housing markets and neighborhoods with older, smaller properties that are available at a deeper discount,” Blomquist continued. “Given that many of these markets are more affordable, we are also seeing a higher share of the flipped homes sold to FHA buyers, with that share reaching a four-year high of 19.6 percent in 2016.”
Home Flipping Profits Reach Record High in 2016
Homes flipped in 2016 sold for a median price of $189,900, a gross flipping profit of $62,624 above the median purchase price of $127,276 and representing a gross flipping return on investment (ROI) of 49.2 percent. Both the gross flipping dollar amount and ROI were the highest going back to 2000.
Among 117 metropolitan statistical areas with at least 250 home flips in 2016, there were 11 with an average gross flipping profit of $100,000 or more in 2016: San Jose, California ($145,750); Boston, Massachusetts ($140,000); San Francisco, California ($140,000); New York, New York ($127,250); Los Angeles, California ($127,000); San Diego, California ($111,000); Oxnard-Thousand Oaks-Ventura, California ($105,000); Seattle, Washington ($102,000); Vallejo-Fairfield, California ($101,000); Baltimore, Maryland ($100,500); and Washington, D.C. ($100,000).
“Our strong wage growth is still supporting rising home prices, which when combined with the historically low number of homes for sale in Seattle, gives home flippers substantial returns on their investments,” said Matthew Gardner, chief economist at Windermere Real Estate, covering the Seattle market. “I believe flipping serves as a negative for any housing market because it further erodes housing affordability, but if there’s a demand for it in the market, it’s a trend we will continue to see.”
States with Highest Gross Flipping Returns
Among the 117 metro areas analyzed in the report, those with the highest gross flipping ROI were East Stroudsburg, Pennsylvania (241.5 percent); Pittsburgh, Pennsylvania (130.0 percent); Cleveland, Ohio (116.2 percent); Philadelphia, Pennsylvania (107.1 percent); Toledo, Ohio (102.0 percent); and New Orleans, Louisiana (101.2 percent).
Along with Pittsburgh, Cleveland, Philadelphia and New Orleans, other metro areas with a population of at least 1 million and a gross flipping ROI in 2016 of 75 percent or higher were Baltimore (96.6 percent); Cincinnati (87.2 percent); Buffalo (85.8 percent); Rochester (76.2 percent); Oklahoma City (76.1 percent); Chicago (75.9 percent); Jacksonville, Florida (75.8 percent); Memphis, Tennessee (75.6 percent); and Grand Rapids, Michigan (75.0 percent).
Highest Home Flipping Rates
Among 117 metropolitan statistical areas with at least 250 home flips in 2016, those with the highest home flipping rate, as a percentage of all home sales, were Memphis, Tennessee (11.7 percent); Clarksville, Tennessee (10.1 percent); Visalia-Porterville, California (10.1 percent); Tampa-St. Petersburg, Florida (9.9 percent); and Deltona-Daytona Beach-Ormond Beach, Florida (9.9 percent).
Along with Memphis and Tampa-St. Petersburg, other metro areas with a population of at least 1 million and a 2016 home flipping rate of at least 7 percent were Las Vegas (9.2 percent); Miami (8.8 percent); Orlando (8.3 percent); Phoenix (8.0 percent); New Orleans (7.9 percent); Jacksonville, Florida (7.7 percent); Virginia Beach (7.6 percent); Baltimore (7.4 percent); Birmingham (7.4 percent); St. Louis (7.1 percent); and Nashville (7.1 percent).
Biggest Increase in Home Flipping Rates
Among 117 metropolitan statistical areas with at least 250 home flips in 2016, those with the biggest year-over-year increase in the home flipping rate were Reading, Pennsylvania (38.8 percent); Lincoln, Nebraska (38.6 percent); East Stroudsburg, Pennsylvania (36.6 percent); Rochester, New York (31.8 percent); and Allentown, Pennsylvania (29.3 percent).
Along with Rochester, other metro areas with a population of at least 1 million and an annual increasing in home flipping rate of at least 10 percent, were New Orleans (up 26.5 percent); San Antonio (up 25.2 percent); Dallas (up 20.9 percent); Boston (up 16.4 percent); New York (up 16.0 percent); Columbus, Ohio (up 14.6 percent); Oklahoma City (up 13.8 percent); Philadelphia (up 11.6 percent); Cincinnati (up 11.5 percent); Grand Rapids, Michigan (up 11.3 percent); Charlotte (up 10.5 percent); Kansas City (up 10.4 percent); and Cleveland (up 10.2 percent).
ZIP Codes: One in Five Home Sales were Flips
Among 5,625 U.S. ZIP codes with at least 10 homes flipped in 2016, there were 39 ZIP codes where at least 20 percent of all home sales during the year were home flips, including ZIP codes in Texas, Tennessee, Florida, California, Ohio, Virginia, Pennsylvania, Missouri, Washington, the District of Columbia, Maryland, New York and New Jersey.
In the Los Angeles metro area, which accounted for six of the 39 ZIP codes with a home flipping rate of at least 20 percent in 2016, the best opportunity for flipping is in lower-priced neighborhoods with properties that need significant repairs, according to Brett Chotkevys, co-founder of Helpful Home Solution, who flips properties in Los Angeles and other parts of Southern California.
“We do pretty much a full gut on the houses we buy. Most of those we buy are pretty nasty … they’re falling down, there are druggies living there,” said Chotkevys, noting that a typical rehab for his Los Angeles flips will run $40,000 to $50,000, and it’s not “inconceivable” for him to spend six figures on a Los Angeles fix-and-flip. “We like south central (Los Angeles) a little bit more. The barrier to entry is lower. We can pick up properties in the $200s. There are normal people not making gobs of money that can afford to buy these houses.”
Click on image for larger graph. Graph will open in separate window.
Click on image for larger graph. Graph will open in separate window.

Click on image for larger graph. Graph will open in separate window.
Click on image for larger graph. Graph will open in separate window.
Click on image for larger graph. Graph will open in separate window.
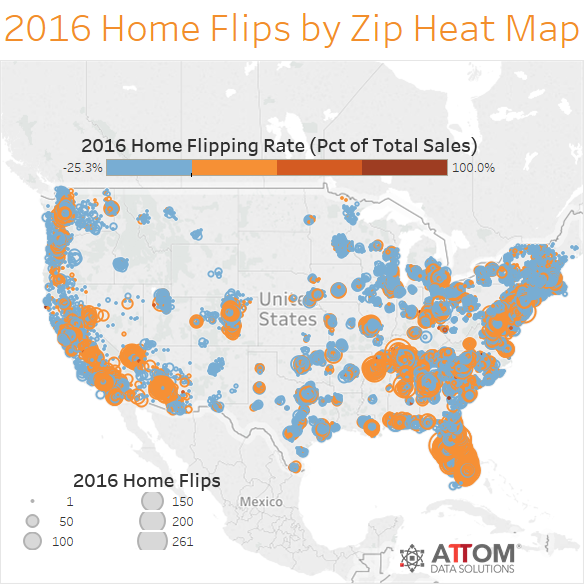
Click on image for larger interactive heat map. Map will open in separate window.
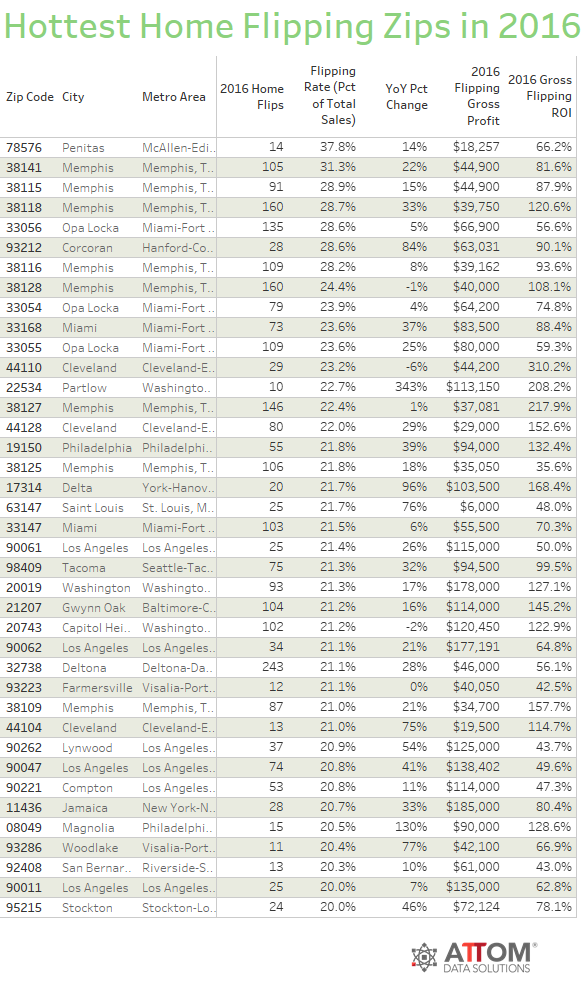
Click on image for larger interactive ZIP code map. Map will open in separate window.
About ATTOM Data Solutions
ATTOM Data Solutions is the curator of the ATTOM Data Warehouse, a multi-sourced national property database that blends property tax, deed, mortgage, foreclosure, environmental risk, natural hazard, health hazards, neighborhood characteristics and other property characteristic data for more than 150 million U.S. residential and commercial properties. The ATTOM Data Warehouse delivers actionable data to businesses, consumers, government agencies, universities, policymakers, and the media in multiple ways, including bulk file licenses, APIs and customized reports.
ATTOM Data Solutions also powers consumer websites designed to promote real estate transparency: RealtyTrac.com is a property search and research portal for foreclosures and other off-market properties; Homefacts.com is a neighborhood research portal providing hyperlocal risks and amenities information; HomeDisclosure.com produces detailed property pre-diligence reports.
Report methodology
ATTOM Data Solutions analyzed sales deed data for this report. A single-family home or condo flip was any transaction that occurred in the quarter where a previous sale on the same property had occurred within the last 12 months. Gross flipping profit was calculated by subtracting the price for the first sale (purchase) from the price of the second sale (flip). Gross flipping return on investment was calculated by dividing the gross flipping profit by the first sale (purchase) price.


0 Comments